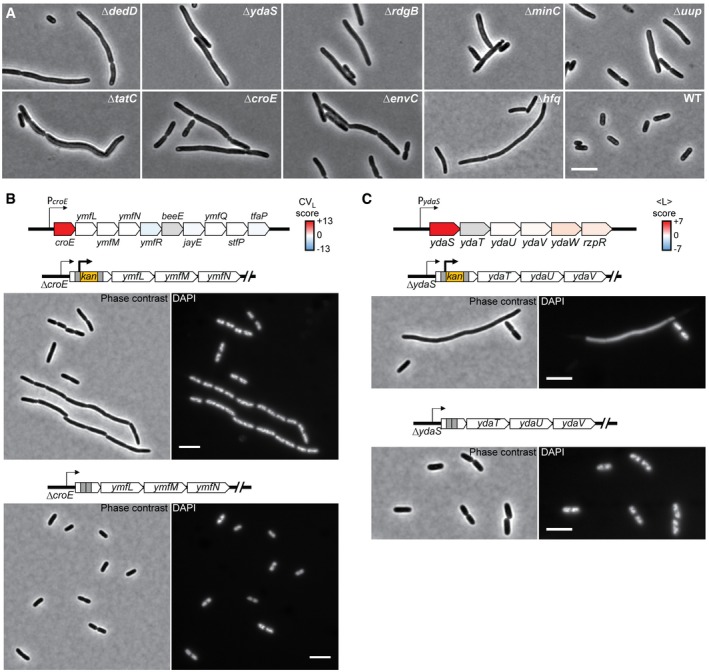
Figure EV1. Filamentous mutants.

- Representative phase‐contrast images of the mutants forming the island 22, together with the parental strain BW25113 (WT) for comparison. Scale bar corresponds to 5 μm.
- Effect of the kanamycin‐resistance cassette on the phenotype of the ΔcroE strain. The schematic at the top shows the color‐mapped score of CV of cell length for the deletion of each gene of the croE operon. Below are phase‐contrast and fluorescent images of DAPI‐stained cells of the ΔcroE strain carrying the kanamycin‐resistance cassette (top) or after the removal of the cassette (bottom). The ymfN locus has been re‐annotated as two separate genes (oweE and aaaE), and the Keio deletion strain of ymfN carries the deletion of these two contiguous genes. Scale bars correspond to 5 μm.
- Effect of the kanamycin‐resistance cassette on the phenotype of the ΔydaS strain. The schematic at the top shows the color‐mapped score of the mean cell length for each gene of the ydaS operon. Below are phase‐contrast and fluorescent images of DAPI‐stained cells of the ΔydaS strain carrying the kanamycin‐resistance cassette (top) or after the removal of the cassette (bottom). Scale bars correspond to 5 μm.
