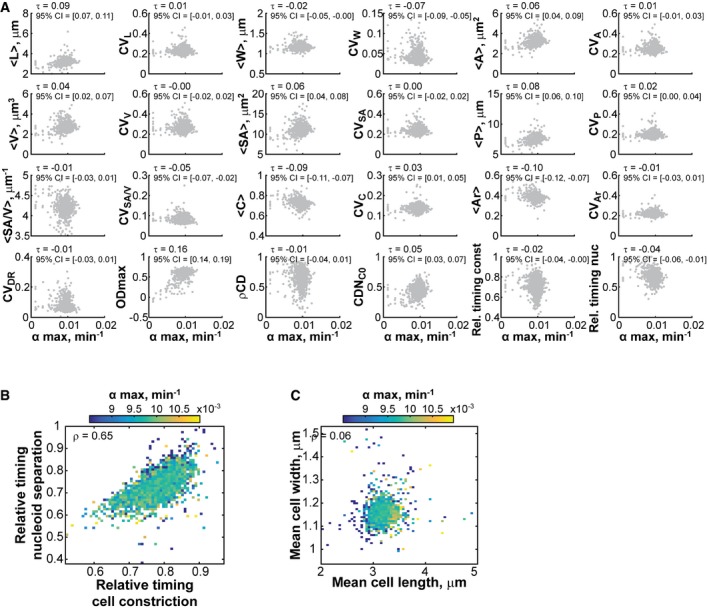
Figure EV4. Growth rate correlates poorly with morphological and cell cycle features.

- Scatter plots of morphological and cell cycle features versus αmax. Each gray dot represents one Keio strain. The Kendall correlation coefficient τ and the associated 95% confidence interval are reported for each pair of features. The confidence intervals were calculated by bootstrapping the correlation 5,000 times and taking the 2.5 and 97.5 percentiles of the resulting distribution. The Kendall rank correlation τ was selected over Pearson correlation because of the heavily asymmetric left tail in the distribution of αmax.
- Heatmap showing the mean growth rate value for data binned by the relative timings of cell constriction and nucleoid separation.
- Same as in (B), except for data binned by mean cell length and mean cell width.
