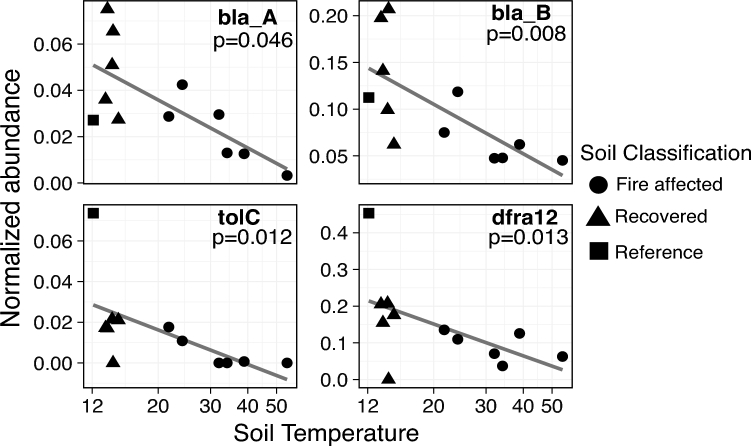
Figure 1.
Negative correlations between normalized abundance of ARGs and soil temperature. Coverage-adjusted abundance for bla_A, bla_B, tolC and dfra12 was normalized to total abundance of the single copy gene rplB. Normalized abundance is plotted against soil temperature. Note the differences in y-axes. The linear trend line and P-value corresponding to the Spearman's rank correlation are shown. Shape indicates soil classification based on fire history.

