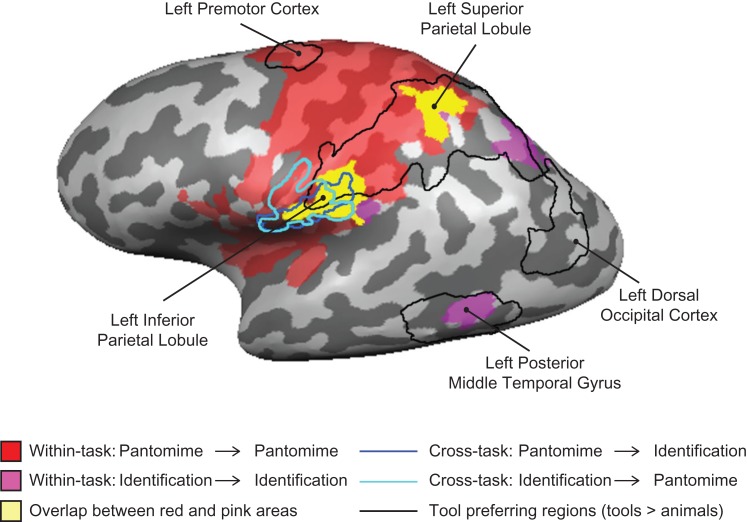
Figure 3.
Direct comparison of tool-preferring regions and searchlight analyses for action. The searchlight results for the within-task decoding of action (red and pink) overlapped tool-preferring regions in the left hemisphere. The overlap of voxels identified as representing actions in both tasks in the searchlight analysis is in yellow. The searchlight results for the cross-task decoding of action were outlined in dark blue and light blue. Tool-preferring regions outlined in black are shown based on group results, thresholded at P < 0.01 (cluster corrected). All results are overlaid on a representative brain.

