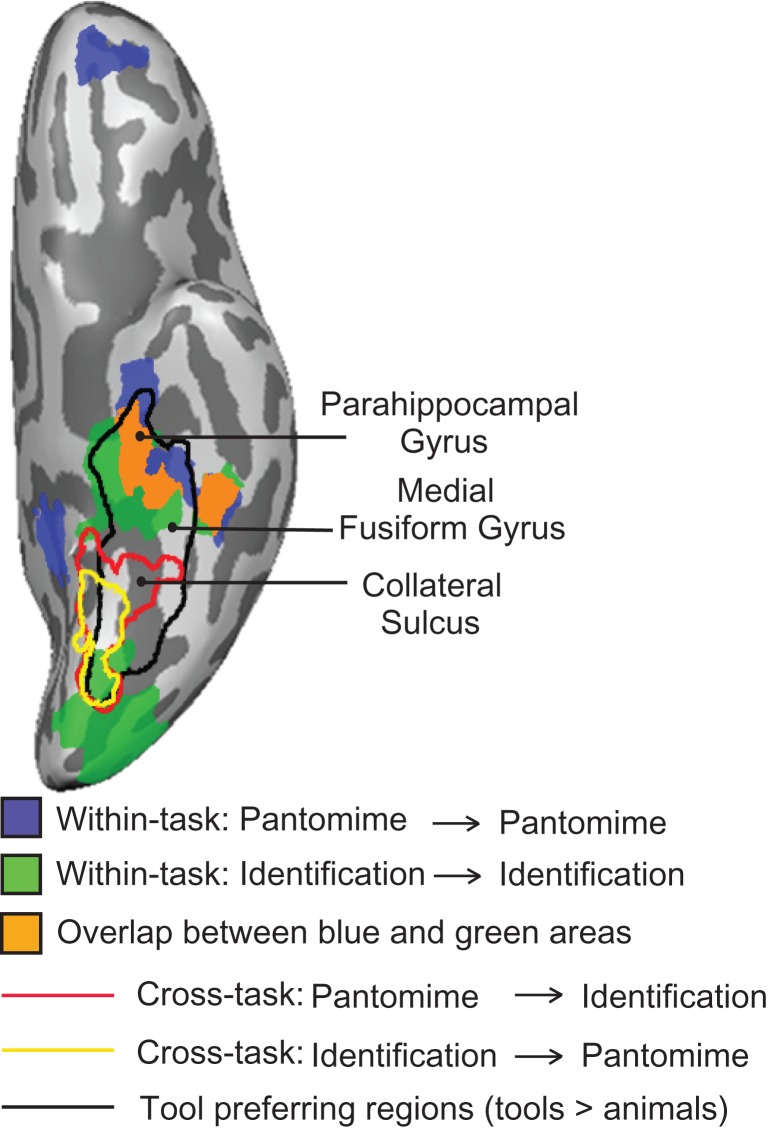
Figure 5.
Direct comparison of tool-preferring regions and searchlight analyses for function. The searchlight results for the within-task decoding of function (light blue and green) overlapped tool-preferring regions in the left hemisphere. The overlap of voxels identified as representing function in both tasks in the searchlight analysis is in dark blue. The searchlight results for the cross-task decoding of function are outlined in red and yellow. Tool-preferring regions outlined in black are shown based on group results, thresholded at P < 0.01 (cluster corrected). All results are overlaid on a representative brain.

