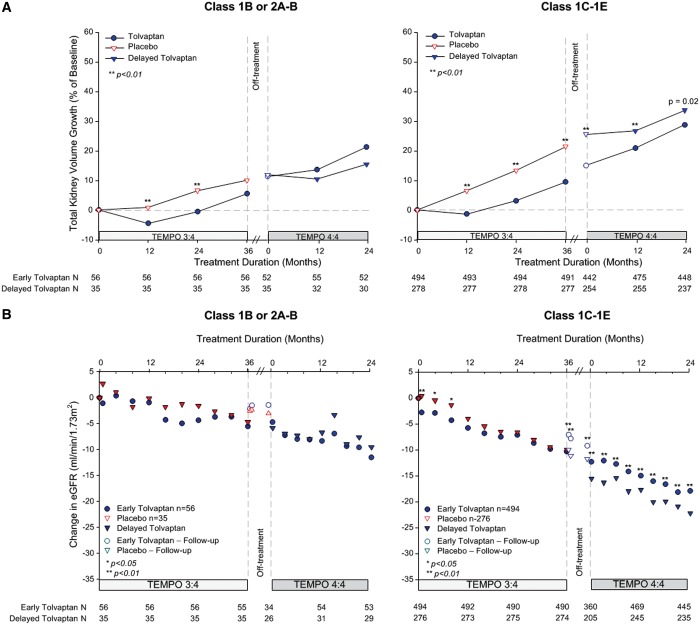
FIGURE 6.
Change from baseline in TKV and eGFR by imaging classification. (A) Percentage change in TKV from TEMPO 3:4 baseline to Month 24 in TEMPO 4:4 for subjects in class 2A–B and 1B (left panel) and class 1C, D, E (right panel). (B) Change in eGFR from TEMPO 3:4 baseline to Month 24 in TEMPO 4:4 for subjects in class 2A–B and 1B (left panel) and class 1C, D, E (right panel). Open circles and triangles represent off-treatment time points.

