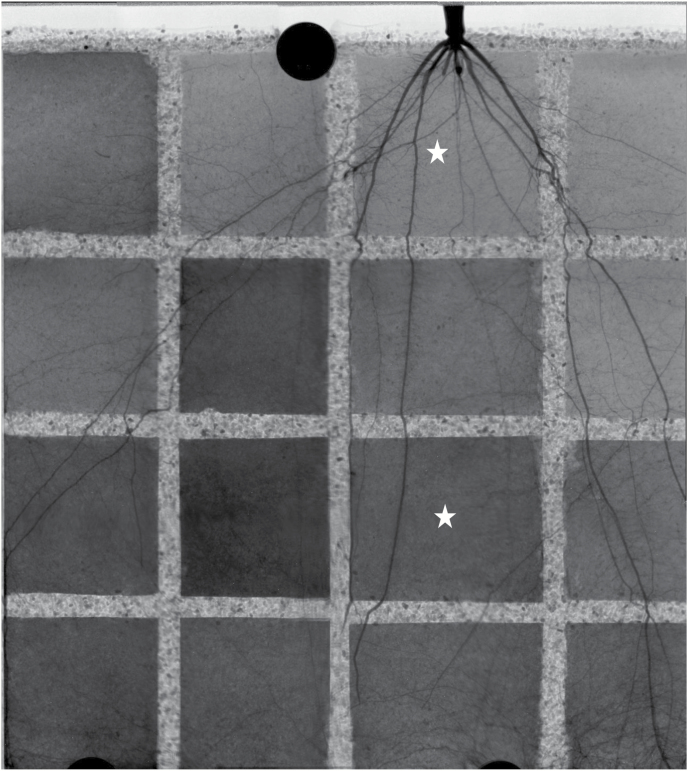
Fig. 1.
Reconstructed image of one sample before the injection of deuterated water (D2O). The figure shows the roots of 5-week-old maize (Zea mays L) and the soil water distribution. The gray scales are proportional to the water content. The darker the image, the higher the soil water content. This image was obtained from stitching together 12 radiographs with an original field of view of 13.3 × 16 cm. The stars show two compartments in which we injected D2O and monitored its transport into soil and roots.

