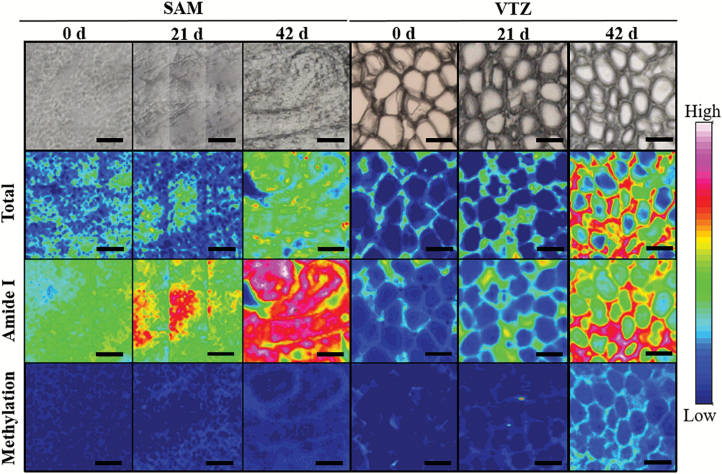
Fig. 5.
Comparisons between chemical maps of a ‘Norstar’ crown transverse section using Fourier transform infrared (FTIR) spectroscopy and imaging using a 64 × 64 focal plane array detector on an FTIR microscope. Sections were taken from plants exposed to 0, 21, and 42 d of cold acclimation. Images are representative of sections taken from one of three biological crown replicates. Each individual micrograph is comprised of nine separate images captured sequentially using a motorized stage and OPUS software. The first row of images shows a light micrograph of the mapped section. The second row of images shows the micrograph overlaid with a false-color map created with infrared spectroscopy using the integrated absorbance of the spectral region between 4000 cm−1 and 900 cm−1. The third row of images shows the micrograph overlaid with infrared spectroscopy using the integrated absorbance of the spectral region between 1700 cm−1 and 1580 cm−1 (amide I), attributed to protein. The third row of images shows the micrograph overlaid with infrared spectroscopy using the integrated absorbance of the spectral region between 1760 cm−1 and 1700 cm−1, attributed to the degree of methyl esterification. A rainbow scheme has been used to denote absorbance, with the warmest colors (red) indicating the highest absorbance, while cool colors (blue) represent a low spectral intensity. White scale=50 μm.

