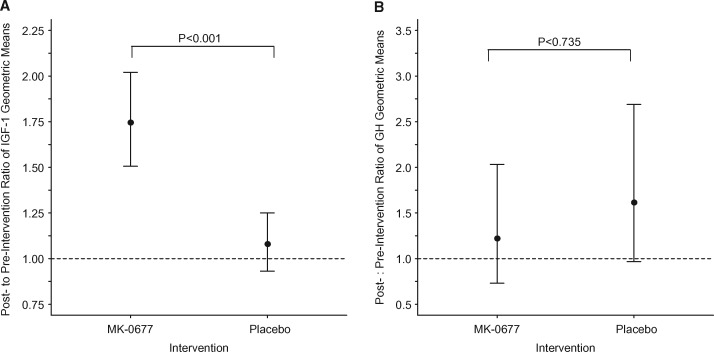
FIGURE 1.
Postintervention:preintervention ratio of IGF-1 and GH geometric means. Circles identify the geometric mean ratio and the vertical lines identify the 95% CIs for the geometric mean ratio. Hatch lines denote the reference line for a geometric mean ratio equal to 1. P-values correspond to the test of the null hypothesis that the ratio of geometric means is the same irrespective of the intervention.

