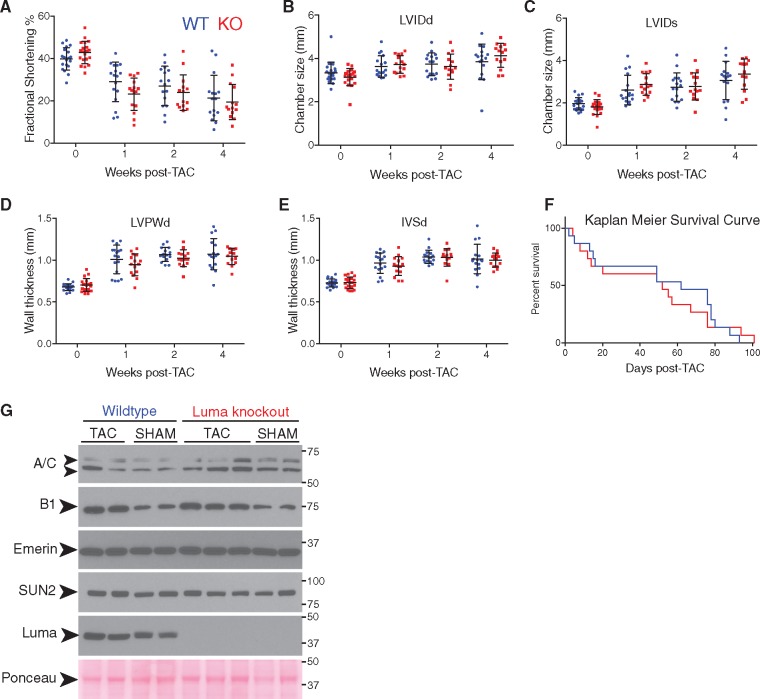
Figure 4.
Luma KO mice exhibit normal hypertrophic response to pressure overload. Echocardiographic measurements of (A) FS, (B) LVIDd, (C) LVIDs, (D) LVPWd, and (E) IVSd) at baseline (0) and 1, 2, and 4 weeks post-TAC surgery in WT and Luma KO mice. Note that as expected, cardiac function significantly deceased after TAC and chamber dimensions and wall thicknesses increased. However, there were no significant changes observed between WT and Luma KO mice. (n = 20 males per genotype). (F) Kaplan–Meier survival analysis showed no significant change in survival between WT and Luma KO mice post-TAC. (G) Western blot analysis of Lamins A/C (A/C), B1 (B1), Emerin, SUN2, and Luma in WT and Luma KO mice 2 weeks post-TAC and SHAM surgeries. Ponceau stain serves as a loading control (n = 4–5 per genotype). Arrowheads show the predicted MW of the indicated proteins. MW is denoted in kDa. P > 0.05 according to two-way ANOVA with Sidak’s post-hoc test (A–E). P = 0.87, Mantel–Cox χ2 test (F).

