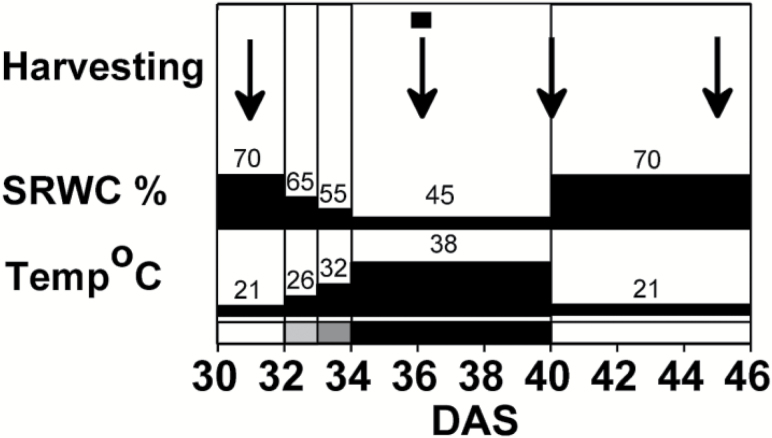
Fig. 1.
Schematic representation of the exposure regime of Arabidopsis thaliana (Col-0) to extremes of climate (elevated heat combined with drought, HD). At 32 d after sowing (DAS) the temperature was increased gradually and water was withheld. The grey-scale on the bottom axis indicates the step-wise temperature increase: light grey, 26/22 ºC (day/night) on 32 DAS; dark grey, 32/26 ºC on 33 DAS; black, 38/30 ºC on 34 DAS. After decreasing to 45%, soil RWC was kept constant. Recovery started at 40 DAS. Sampling time-points for metabolite analyses are indicated by the arrows, and the microarray analysis is indicated by the square (at 36 DAS).

