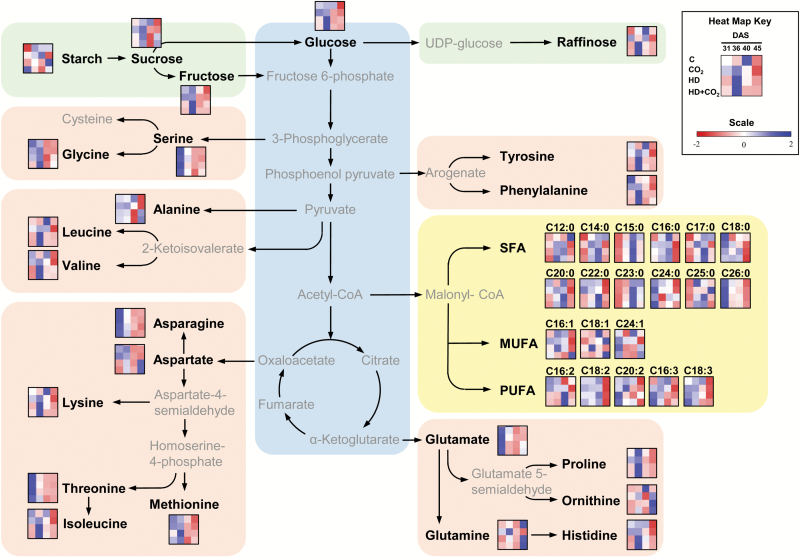
Fig. 6.
Overview of all metabolite concentrations, organised by class of molecule and biosynthetic origin. The 4 × 4 heat maps represent normalized metabolite levels at different time-points [horizontal: 31, 36, 40, 45 d after sowing (DAS)] and treatments (vertical: C, ambient CO2, i.e. control; CO2, control plus elevated CO2; HD, combined heat and drought at ambient CO2; HD + CO2, combined heat and drought at elevated CO2).

