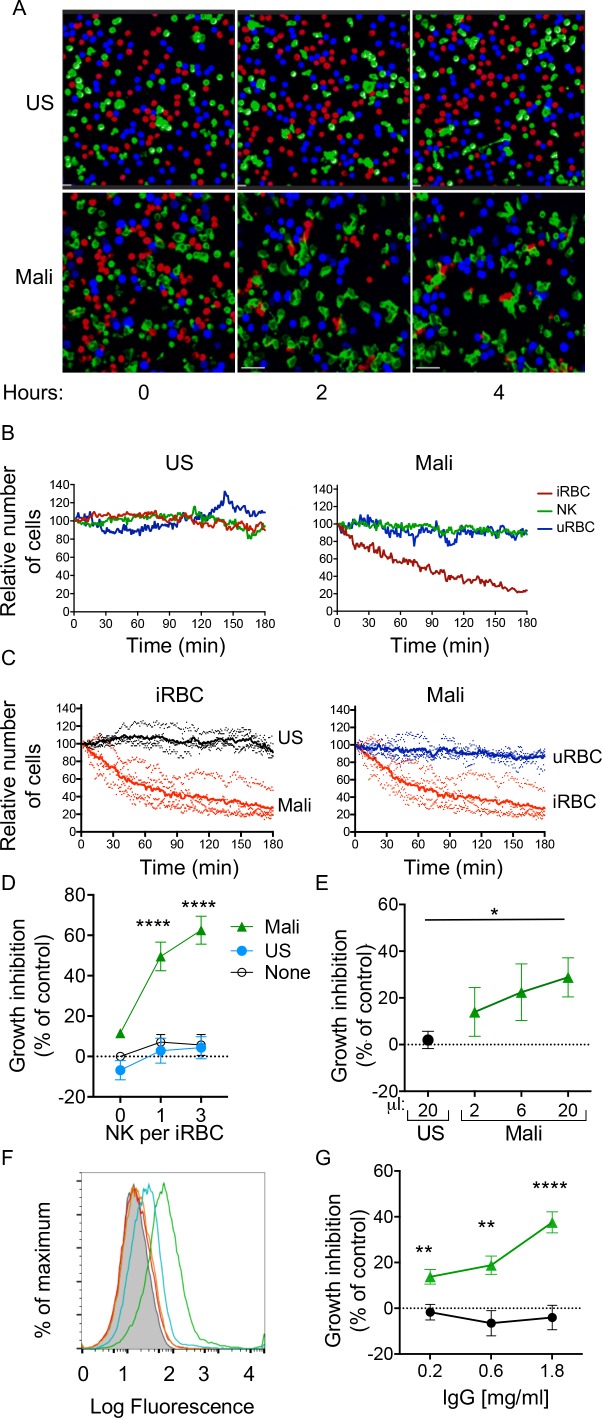
Figure 2. Selective lysis of P.f. 3D7-iRBCs and parasite growth inhibition by primary NK cells in the presence of immune plasma and IgG.
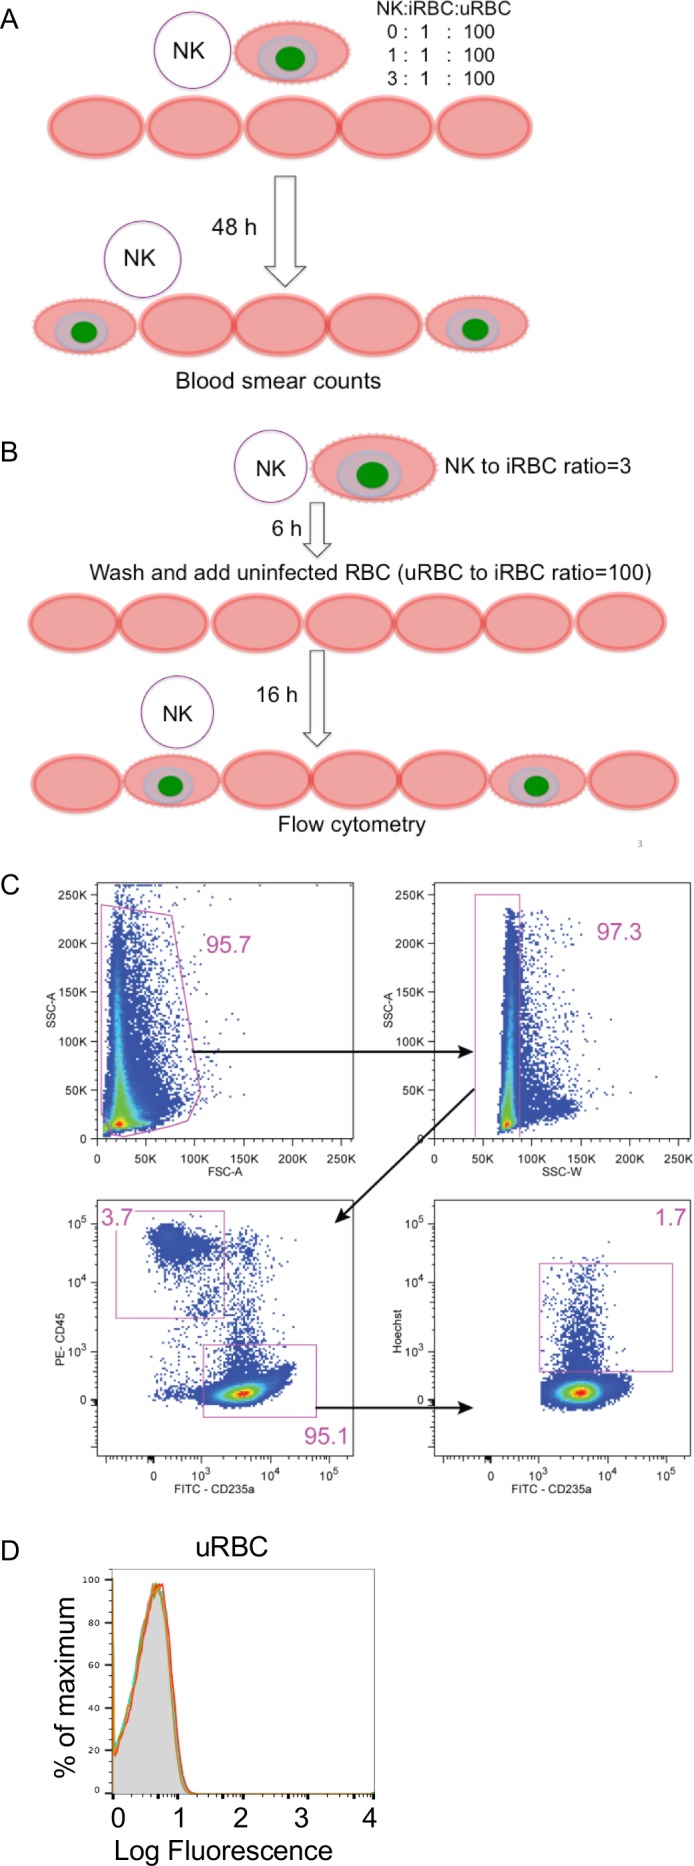
(A) Live imaging of primary NK cells (green) co-incubated with uRBCs (blue) and iRBCs (red) at an equal ratio (1:1:1) in the presence of US serum (1:10) and of Mali plasma (1:10). Representative snapshots taken at time 0, 2, and 4 hr are shown. (B) Quantitative analysis of cell numbers in the cultures shown in (A) in a 3 hr period. Cell numbers were normalized to 100 at the start of image acquisition. (C) Composite display of 4 independent experiments, each carried out with a different NK cell donor (dotted lines). The mean is shown as a solid line (t test, p<0.0001). (D) Inhibition of parasite growth measured by counting blood smears of iRBCs. A parasite culture containing 1% iRBCs was incubated for 48 hr in the absence (open circles) or presence of US serum (closed circles) or Mali plasma (triangles). Growth inhibition is represented as percent decrease in parasitemia relative to a culture with no NK cells and no Ab. Error bars represent standard deviation of the mean from four independent experiments (ANOVA, p<0.0001 for no NK or US serum group compared with Mali plasma groups in presence of NK cells). (E) Parasite growth inhibition measured by flow cytometry. Enriched trophozoite-stage iRBCs were incubated with NK cells at an NK:iRBC ratio of 3:1 for 6 hr with either 20 μl US serum or increasing amounts of Mali plasma in a final volume of 200 μl. Cells were washed and incubated for another 16 hr with a 100-fold excess of uRBCs (relative to the iRBC input). Inhibition is expressed as a percent decrease in parasitemia relative to parasitemia in iRBC cultures incubated with NK cells in the absence of Abs (ANOVA, p=0.0294). (F) Staining of iRBCs with IgG affinity-purified from US serum at 0.2 (orange) and 0.6 mg/ml (red), or from Mali plasma at 0.2 (blue) and 0.6 mg/ml (green). (G) Growth inhibition assay performed as in (E) in the presence of purified IgG from US (black circles) or Mali individuals (green triangles) at the indicated concentrations (t test p(0.2) = 0.008; p(0.6) = 0.003; p(1.8) = 0.00007).
Figure 2—figure supplement 1. Assays for NK-dependent parasite growth inhibition.


