. 2018 Jun 26;7:e34135. doi: 10.7554/eLife.34135

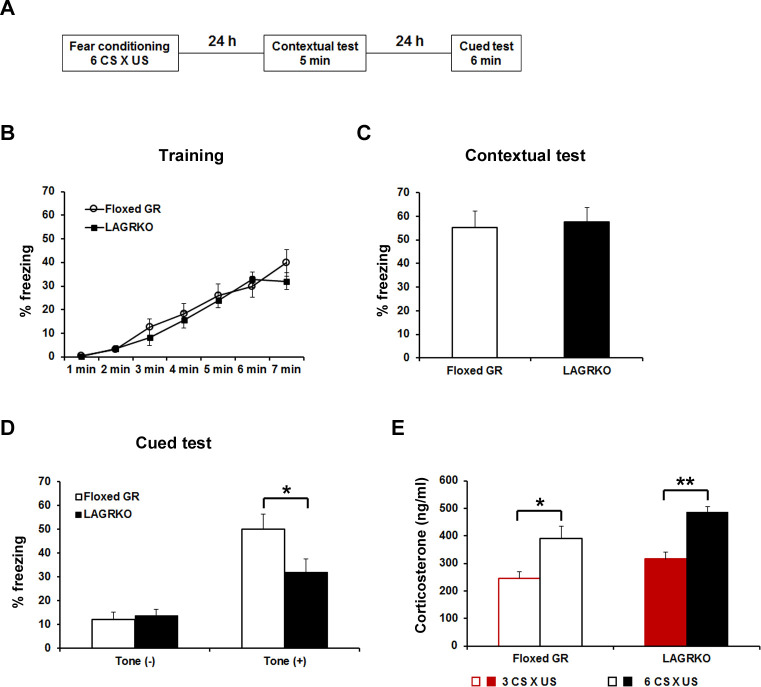
Figure 3. Genetic disruption of LAGR impairs auditory-cued fear memory following strengthened conditioning.

(A) Experimental protocol for fear conditioning. Mice were trained with a protocol using six CS × US pairings. Contextual and auditory-cued fear memory were tested 24 and 48 hr after training, respectively. Freezing levels during the training (B), contextual test (C), and cued test (D). During the cued test, LAGRKO mice (n = 10) exhibited significantly lower freezing levels in the presence of the tone than did floxed GR mice (n = 10). There was no significant difference in freezing levels between the two genotypes during the training and contextual test. (E) Plasma corticosterone levels 90 min after training were significantly higher in mice conditioned with six CS × US pairings (n = 7) than in mice conditioned with 3 CS × US pairings (n = 6) in both genotypes. Data are presented as mean ± S. E. M. *p<0.05, **p<0.001.

Figure 3—source data 1. Raw data for generating Figure 3B–E.
DOI: 10.7554/eLife.34135.010

Figure 3.

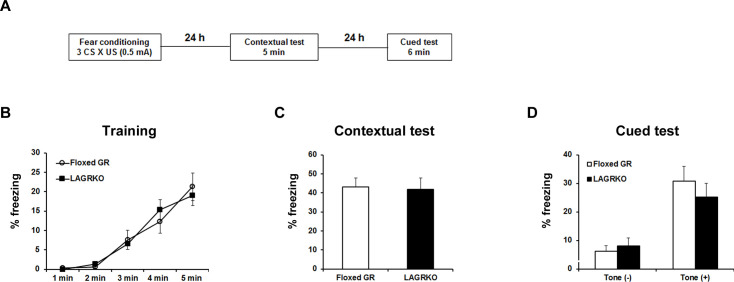
Figure 3—figure supplement 1. LAGRKO mice did not exhibit fear memory deficits with the moderate fear conditioning protocol.

Figure 3—figure supplement 1.

(A) Experimental design for fear conditioning. Mice were trained with three CS × US pairing protocol. Contextual and auditory fear memories were tested 24 and 48 hr after training, respectively. Freezing levels during the training (B), contextual test (C), and cued test (D). Data are presented as mean ± S. E. M. Floxed GR, n = 10; LAGRKO, n = 16. Data are presented as mean ± S. E. M.
Figure 3—figure supplement 2. LAGRKO mice exhibited no changes in locomotor activity and anxiety level as determined using the open field test.

Figure 3—figure supplement 2.

Distance of travel throughout the apparatus (A) and in the center zone of the open field (B) and time spent in the center of the open field (C) did not differ between the two genotypes. Floxed GR, n = 15; LAGRKO, n = 10. Data are presented as mean ± S. E. M.