. 2018 May 29;7:e36440. doi: 10.7554/eLife.36440

Figure 2. Light responses of brain ciliary photoreceptors and their downstream circuitry in Platynereis larvae.

(A) Acetylated tubulin staining of a 72 hpf larva. The ramified sensory cilia of cPRCs are marked with dashed lines. (B) TEM image of a section with a cPRC. Cell body in green, sensory cilia outlined in dashed white. (C) TEM image of a cPRC with sensory cilia. Yellow arrows mark the basal bodies of a cPRC. (D) Serial TEM reconstruction of the sensory cilia of a cPRC. (E) Absorption spectrum of purified Platynereis c-opsin1. Inset: dark-light difference spectrum. (F) Top: high GCaMP6s signal in the cPRCs during imaging conditions. Asterisks mark cPRC nuclei. Bottom: activation of two sensory neurons (SNearly) upon violet stimulation of cPRCs. (G) Top: representative example of cPRC response to prolonged local 488 nm and 405 nm stimulation. The colored boxes show the duration of the stimulation. Bottom: average cPRC response during continuous 488 nm and 405 nm stimulation. Data show mean and s.d. of mean, 488 nm N = 8, 405 nm N> 30. (H) Responses of a cPRC to repeated 405 nm and 488 nm (duration: 20 s) stimulation. (I) Responses of SNearly and SNlate sensory neurons to cPRC 405 nm stimulation. Correlation images are shown for SNearly and SNlate. Asterisks mark cPRC nuclei. (J) Responses of RGW cells to UV stimulation of a cPRC. Scale bars: (A) 50 μm (B) 10 μm, (F) 20 μm.

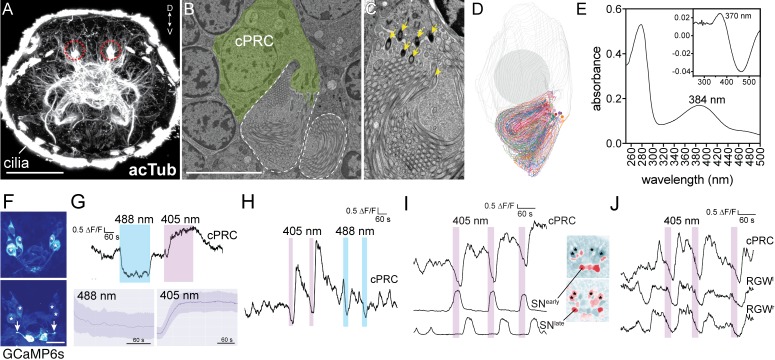
Figure 2—source data 1. Light and dark-light difference spectrum of Platynereis c-opsin1 and calcium imaging traces for panels G-J.
DOI: 10.7554/eLife.36440.014

Figure 2.

Figure 2—figure supplement 1. Quantification of stimulus-light intensity during the local stimulation of cPRC cilia.

Figure 2—figure supplement 1.

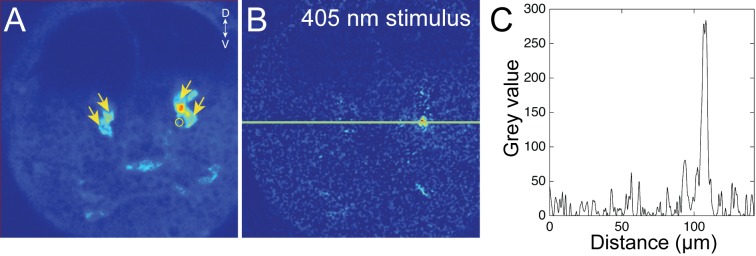
(A) The four cPRCs (arrows) are recognized based on their high GCaMP6s fluorescence. A region of interest used to deliver the 405 nm stimulation with the independent SIM scanner is shown (circle). (B) Distribution of 405 nm light scattered by the sample. (C) Quantification of signal intensity based on the line shown in (B).
Figure 2—figure supplement 2. Calcium imaging in Platynereis larvae combined with the stimulation of cPRCs.

Figure 2—figure supplement 2.

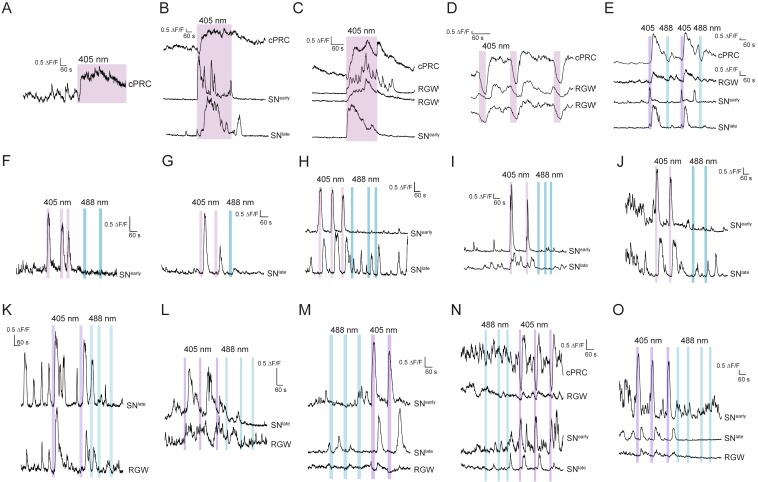
(A) cPRC response to prolonged local 405 nm stimulation. (B) Response of a cPRC, an SNearly and an SNlate sensory neuron to prolonged 405 nm stimulation. (C) Response of a cPRC, two RGW interneurons, and an SNearly sensory neuron to prolonged 405 nm stimulation. (D) Responses of a cPRC and two RGW interneurons to repeated 405 nm stimulation of 20 s duration. (E) Responses of a cPRC, RGW, SNearly and SNlate neuron to alternating 405 and 488 nm light. (F) Responses of an SNearly sensory neuron to repeated 405 and 488 nm stimulation. (G) Responses of an SNlate sensory neuron to repeated 405 and 488 nm stimulation. (H–J) Responses of SNearly and SNlate sensory neurons to repeated 405 and 488 nm stimulation. (K–O) Responses of cPRC, RGW, SNearly and SNlate neurons to repeated 405 and 488 nm stimulation. The stimulation in D-O was 20 s.
Figure 2—figure supplement 2—source data 1. Source data of Figure 2—figure supplement 2 panels A-I.
DOI: 10.7554/eLife.36440.012
Figure 2—figure supplement 3. Ultrastructure of cPRCs in a Platynereis larva.

Figure 2—figure supplement 3.

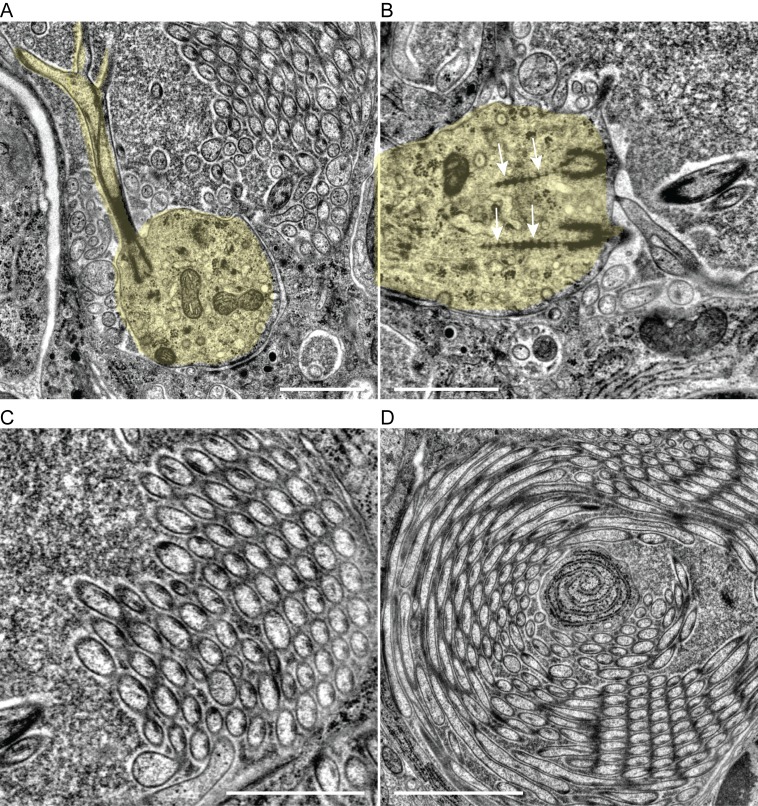
(A) TEM image of the sensory area of a cPRC showing a branching cilium. The sensory dendrite and cilium are highlighted. (B) TEM image showing ciliary roots in a cPRC. The sensory dendrite is highlighted. Arrows point to ciliary roots. (C, D) TEM images showing the curved parallel branches of cPRCs. Each branch is supported by a single microtubule doublet. Scale bars: 1 μm.