. 2018 May 31;7:e35122. doi: 10.7554/eLife.35122

Figure 1. Hydra growth and differential expression of Hydra genes resulting from symbiosis.

(A) Hydra viridissima strain A99 used for this study. Scale bar, 2 mm. (B) Growth rates of polyps grown with native symbiotic Chlorella A99 (Hv_Sym, dark green), Aposymbiotic polyps from which Chlorella were removed (Hv_Apo, orange) and aposymbiotic polyps reinfected with Chlorella variabilis NC64A (Hv_NC64A, light green). Average of the number of hydra in each experimental group (n = 6) is represented. Error bars indicate standard deviation. (C) Graphic representation of differentially expressed genes identified by microarray. The transcriptome of Hv_Sym is compared with that of Hv_Apo and Hv_NC64A with the number of down-regulated contigs in Hv_Sym shown in red and those up-regulated in green. Genes differentially expressed in Hv_Sym compared to both Hv_Apo and Hv_NC64A are given as ‘A99-specific’, those differentially expressed between Hv_A99 and Hv_Apo but not Hv_NC64A as ‘Symbiosis-regulated’. (D) GO distribution of Biological Process at level two in all contigs (All), up-regulated contigs (Hv_Sym > Hv_Apo) and down-regulated contigs (Hv_Sym < Hv_Apo) in Hv_Sym. (E) Overrepresented GO terms in up-regulated contigs (Hv_Sym > Hv_Apo) and down-regulated contigs (Hv_Sym < Hv_Apo). Category, F: molecular function, C: cellular component, P: biological process. P-values, probability of Fisher’s exact test. #Test, number of corresponding contigs in differentially expressed contigs. #Ref, number of corresponding contigs in all contigs.

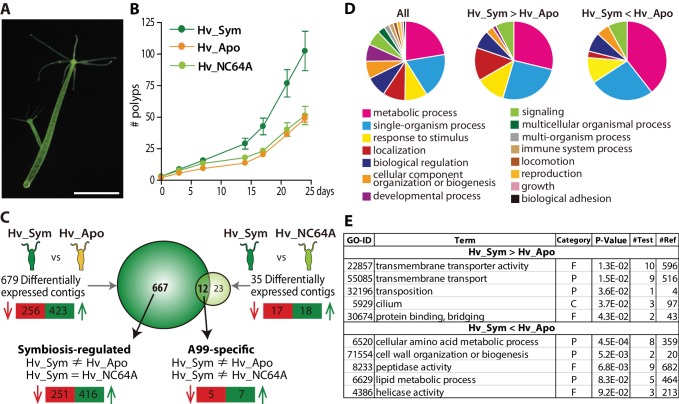
Figure 1—source data 1. GO distribution of Biological Process in all contigs (All), up-regulated contigs (up: Hv_Sym > Hv_Apo) and down-regulated contigs (down: Hv_Sym < Hv_Apo) in Hv_Sym.
DOI: 10.7554/eLife.35122.007

Figure 1.

Figure 1—figure supplement 1. Chlorella sp. A99 and Chlorella variabilis NC64A in Hydra viridissima A99.

Figure 1—figure supplement 1.

(A) Average number of algae per Hydra cell, for native Chlorella sp. A99 (Hv_Sym) and aposymbiotic Hydra re-infected with Chlorella variabilis NC64A (Hv_NC64A). P: p-value of student t-test. (B) Endodermal epithelial cells of Hv_Sym showing intracellular algae (C) Endodermal epithelial cells of Hv_NC64A. Scale bar, 20 µm.
Figure 1—figure supplement 2. Conserved genes and species-specific genes differentially expressed in symbiotic Hydra.

Figure 1—figure supplement 2.

Distribution of well-conserved Hydra viridissma genes (pink), Hydra viridissima-specific genes (green) and other genes (shared by some but not all metazoans, gray) among eight metazoans: Hydra magnipapillata, Acropora digitifera, Nematostella vectensis, Strongylocentrotus pupuratus, Branchiostoma floridae, Homo sapiens and Drosophila melanogaster and Hydra viridissima A99. Pie charts are shown for all contigs (All), up-regulated contigs (Hv_Sym > Hv_Apo) and down-regulated contigs (Hv_Sym < Hv_Apo).
Figure 1—figure supplement 3. Glutamine synthetase (GS) genes in Cnidarians.

Figure 1—figure supplement 3.

(A) Phylogenetic tree of the GS gene of four species in Cnidarians. While anthozoans (Nematostella vectensis, Acropora digitifera) have a single GS gene, Hydra magnipappilata (Hma) has five genes and Hydra viridissima A99 has three genes, Hv_1046 (GS-1), Hv_315 (GS-2) and Hv_4671 (GS-3). (B) Average of relative expression level of the three GS genes in Hv_Sym, Hv_NC64A and Hv_Apo as determined by microarray analysis. Error bars indicate standard deviation. P-value of t-test, *<0.05.