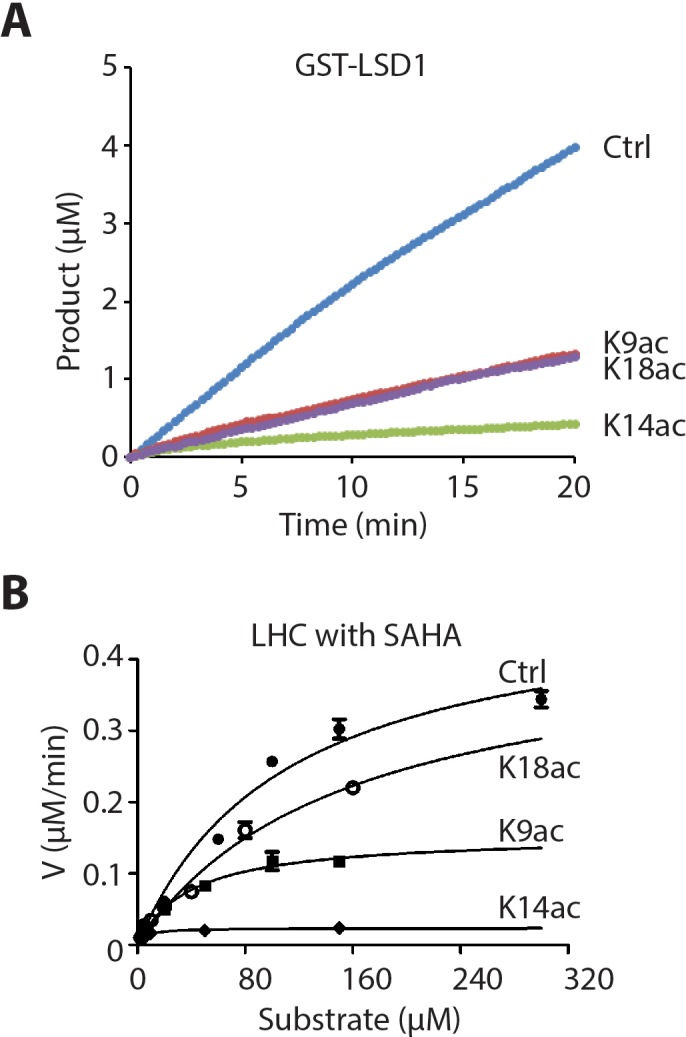
Figure 3. LHC demethylase activity with H3 tail peptide substrates containing Kac.
(A) Comparison of LHC-catalyzed demethylation of 100 μM peptide substrate with H3K4me2 (Ctrl), H3K4me2K9ac (K9ac), H3K4me2K14ac (K14ac), and H3K4me2K18ac (K18ac) by 100 nM LHC. The four substrates were also analyzed in the presence of 10 μM SAHA. (B) Summary of the steady-state kinetic parameters based on the initial phase (0–2 min) of the reactions in the presence of SAHA. (p<0.005 for Km and kcat of H3K4me2 peptide vs. H3K4me2K14ac peptide substrates); (n = 3 for all measurements) error bars represent S.E.M.; kinetic parameters are shown ± S.E.M.
Figure 3—figure supplement 1. Isolated LSD1 demethylase activity with H3 tail peptide substrates containing Kac.


