. 2018 Jun 26;7:e36245. doi: 10.7554/eLife.36245

Figure 1. HTLV-1 forms distant contacts with the host genome.

(A) Upper line: the HTLV-1 genome (green), with a long terminal repeat (LTR) at each end, is integrated into a clone-specific site in the human genome (grey). The q4C viewpoint (blue rectangle) is the NlaIII fragment within the HTLV-1 genome (nucleotide residues 6564–7246) which contains the CTCF binding site (CTCF-BS; black arrowhead). Lower line: the CTCF-BS (blue hexagon) in the provirus can dimerize with a CTCF-BS in the flanking host genome. (B) Chromatin contacts identified by q4C in two different clones. For each clone, the top panel depicts the q4C profile in the 5′ and 3′ host genome flanking the provirus (two biological duplicates), quantified as the normalized frequency of ligation events in overlapping windows (window width 10 kb, step 1 kb). On the horizontal axis, positive values denote positions downstream of the provirus (i.e. lying 3′ of the 3′ LTR); negative values denote upstream position. VP – viewpoint in q4C (proviral integration site). Diamonds mark the positions of reproducible chromatin contact sites called by the peak caller (Materials and methods). CTCF panel – open arrowheads denote positions of CTCF-BS; the filled arrowhead denotes the CTCF-BS in the provirus. Genes panel shows RefSeq protein-coding genes in the flanking host genome. The q4C profiles of remaining clones are shown in Figure 1—figure supplement 110. (C) Number of detected peaks in each clone. (D) Distance from detected q4C peaks to the respective proviral integration site.

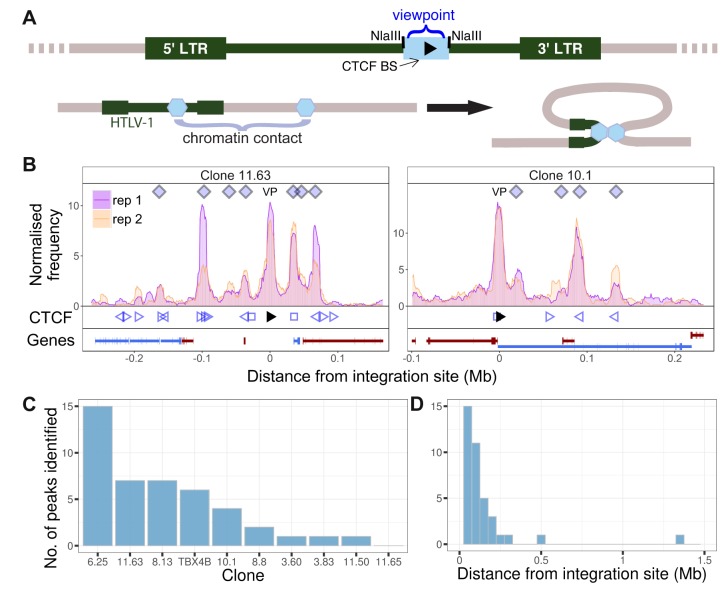
Figure 1.

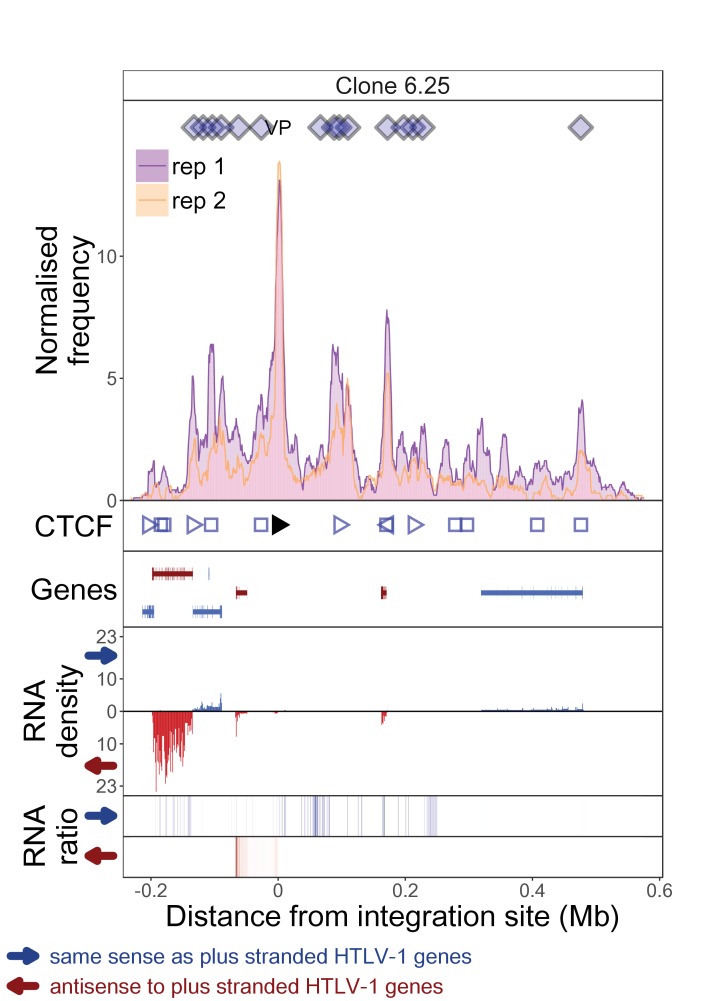
Figure 1—figure supplement 1. q4C and RNASeq data aligned – clone 6.25.

Figure 1—figure supplement 1.

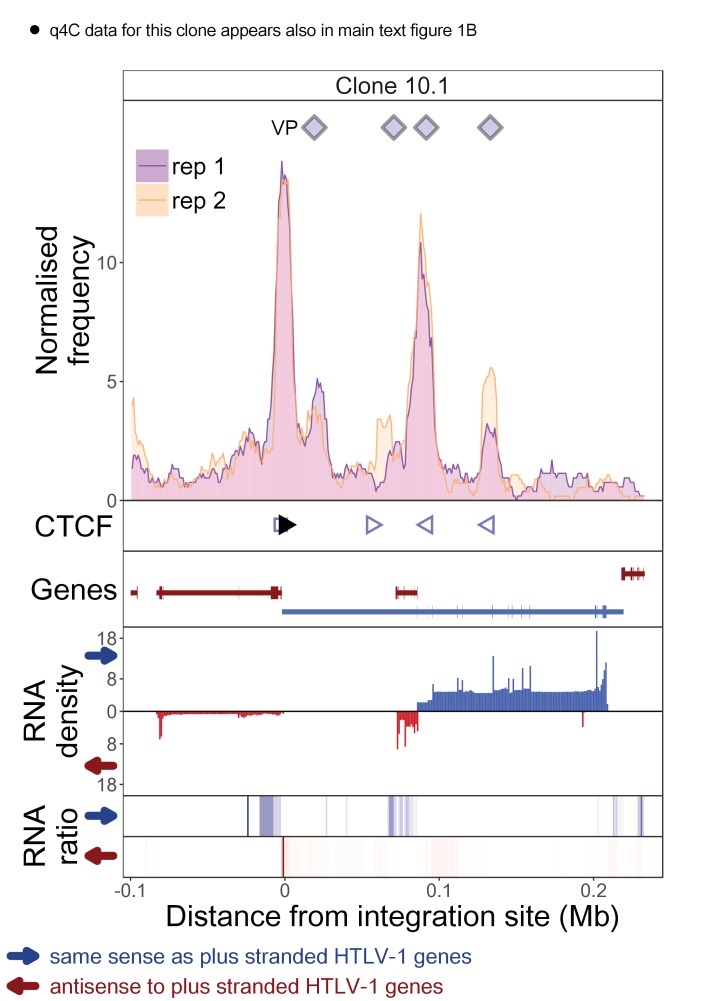
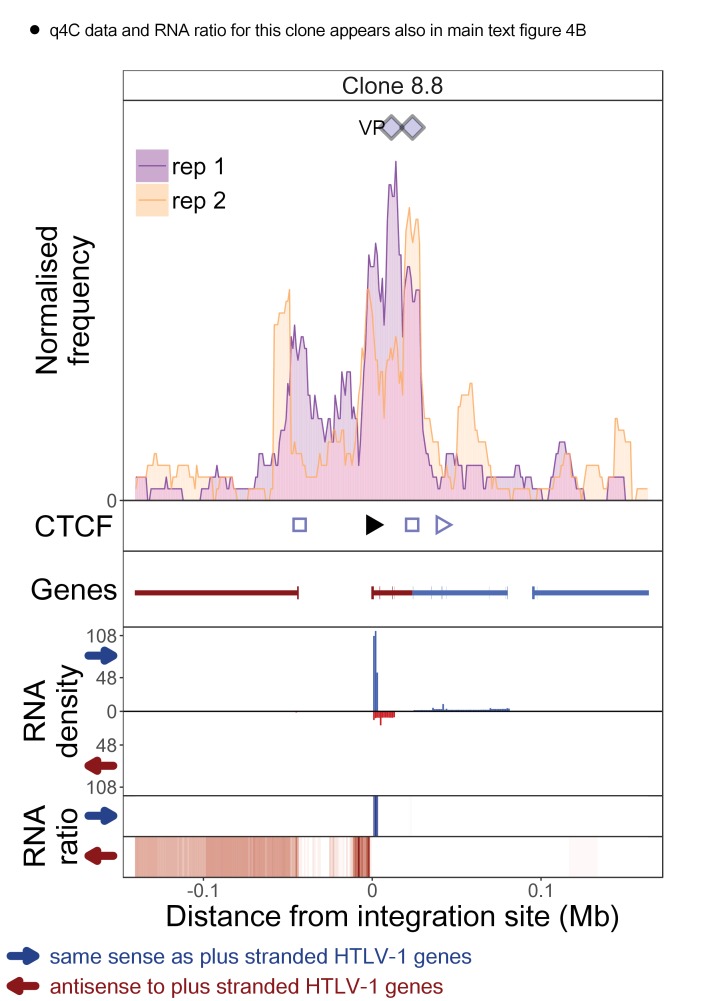
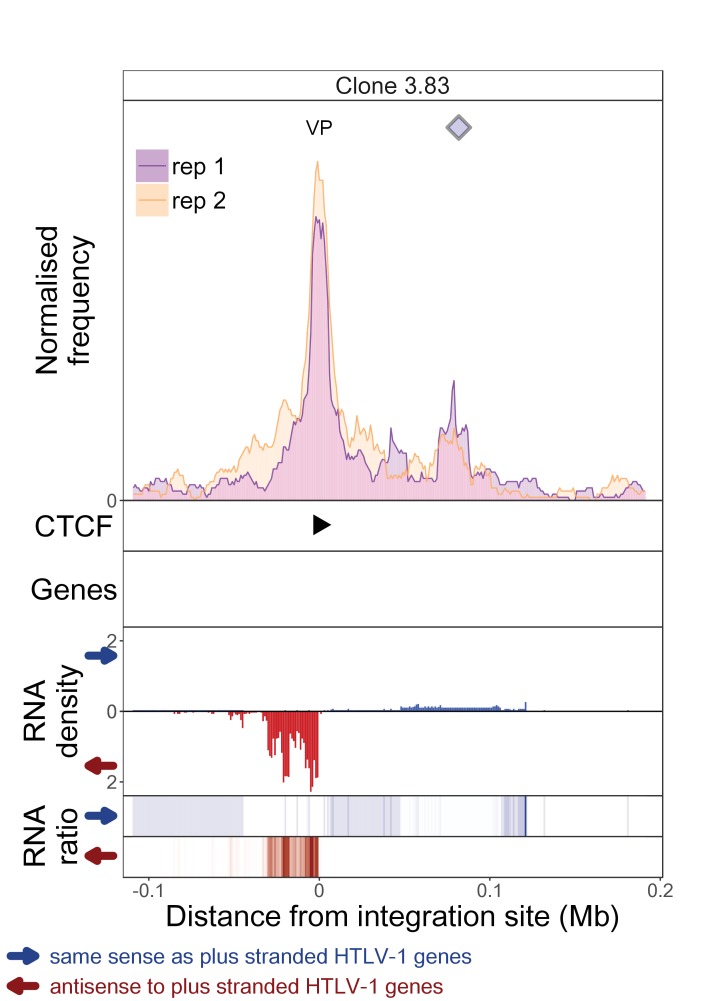
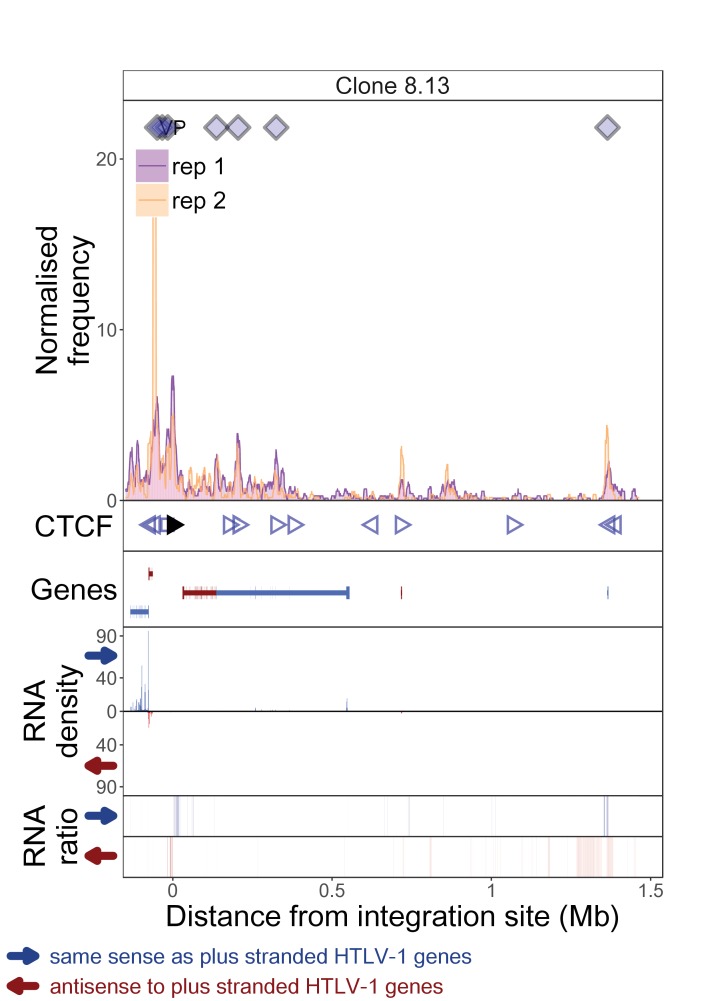
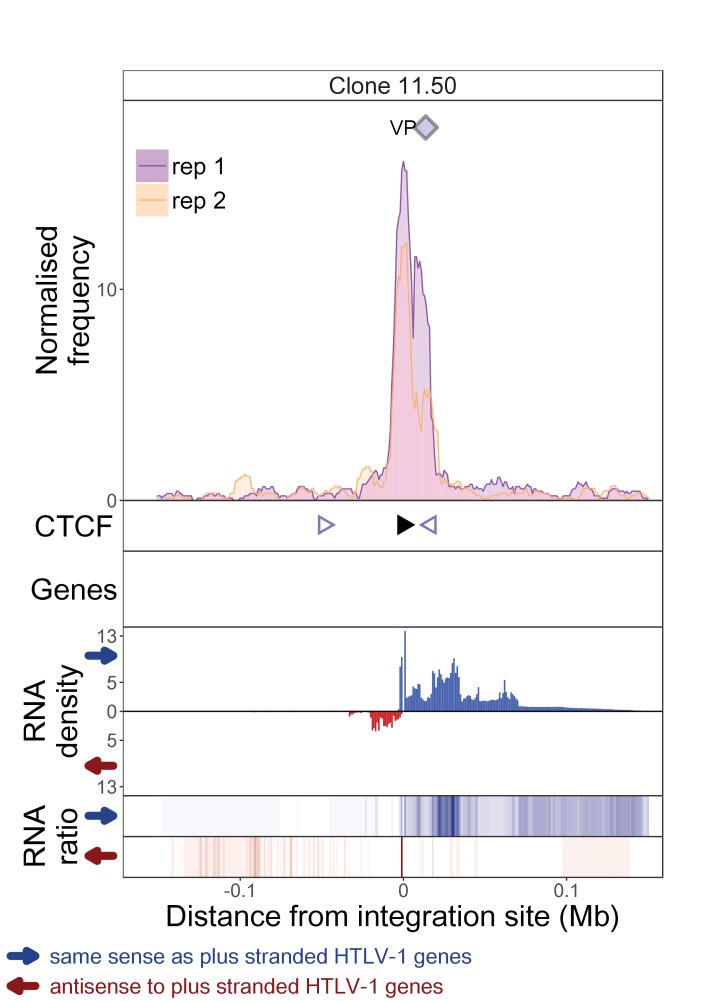
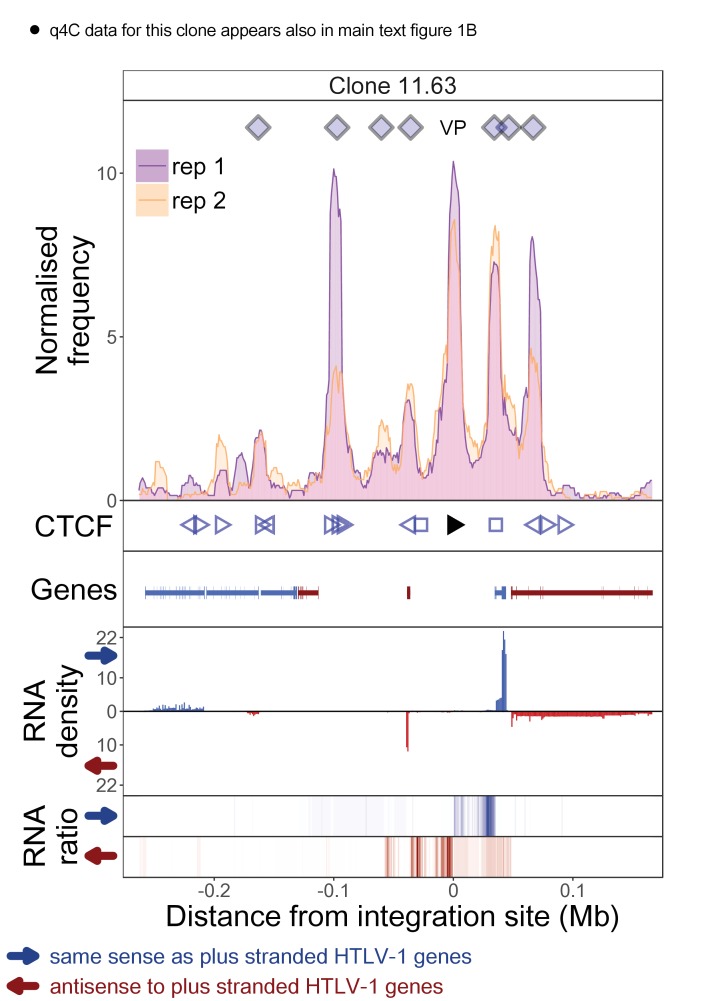
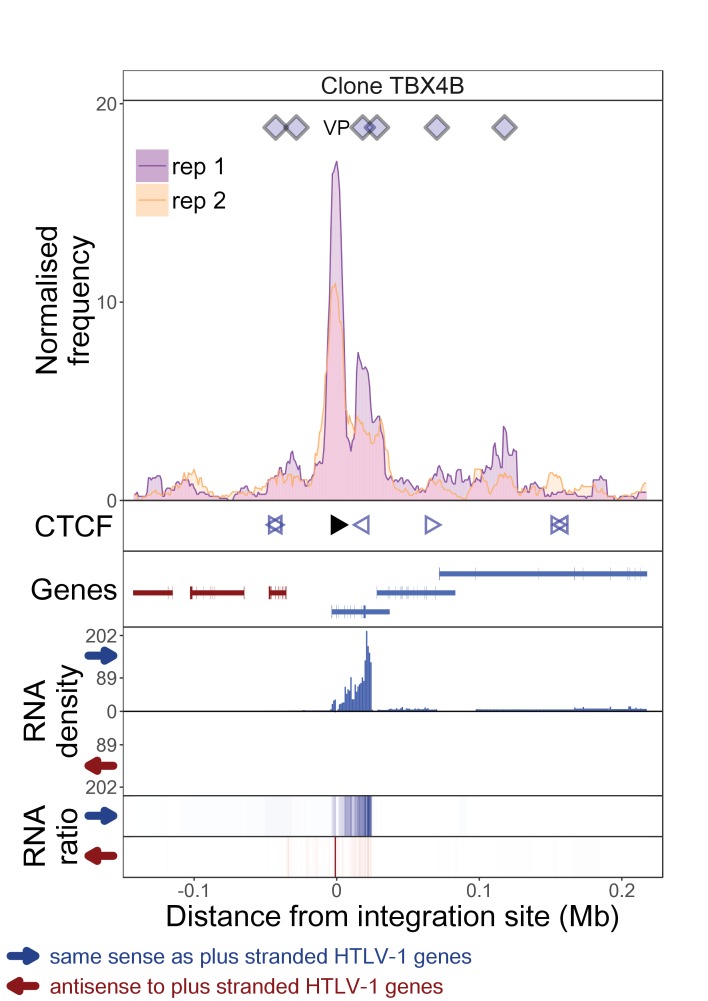
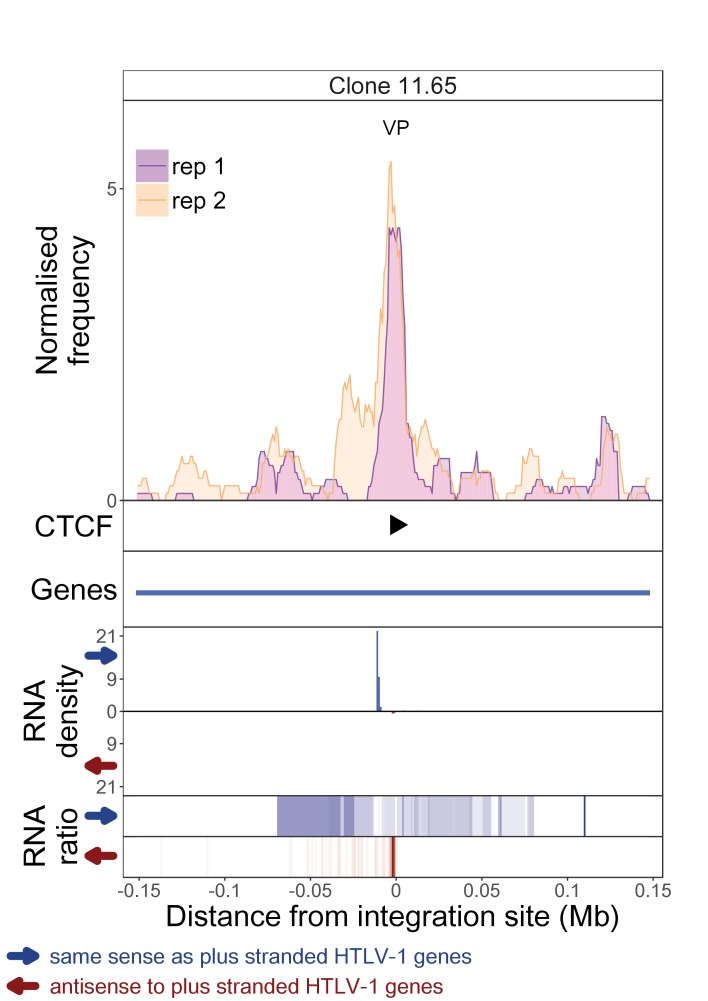
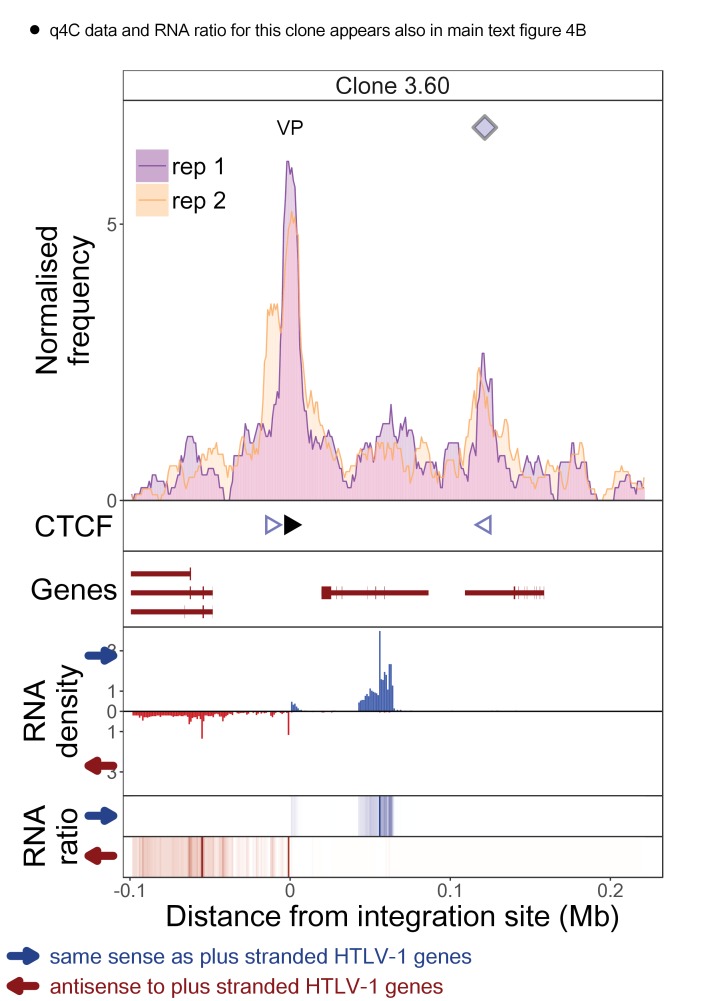
The distance from the integration site was chosen such that all called peaks are shown. For each clone, the top panel depicts q4C profile in the infected chromosome in duplicate (normalized frequency of ligation events in overlapping 10 kb windows, step 1 kb). On the horizontal axis, positive values denote positions downstream of the provirus (i.e. lying 3′ of 3′ LTR), negative values denote upstream position. VP – viewpoint in q4C (proviral integration site). Diamonds mark the positions of reproducible chromatin contact sites called by the peak caller. CTCF panel – open arrowheads denote positions of CTCF-BS. The filled arrowhead denotes the CTCF-BS in the provirus. Genes panel shows RefSeq protein coding genes in the genomic environment. RNA density – the normalized transcription density in 1 kb bins in same (blue) or opposite (red) orientation compared to the HTLV-1 plus-strand. RNA ratio – the ratio of transcription density over the median of all clones in the same position in same (blue) or opposite (red) orientation. Clones also displayed in main body of the paper are highlighted at the top of the page.
Figure 1—figure supplement 2. q4C and RNASeq data aligned – clone 10.1.

Figure 1—figure supplement 2.

Figure 1—figure supplement 3. q4C and RNASeq data aligned – clone 8.8.

Figure 1—figure supplement 3.

Figure 1—figure supplement 4. q4C and RNASeq data aligned – clone 3.83.

Figure 1—figure supplement 4.

Figure 1—figure supplement 5. q4C and RNASeq data aligned – clone 8.13. .

Figure 1—figure supplement 5.

Figure 1—figure supplement 6. q4C and RNASeq data aligned – clone 11.50. .

Figure 1—figure supplement 6.

Figure 1—figure supplement 7. q4C and RNASeq data aligned – clone 11.63. .

Figure 1—figure supplement 7.

Figure 1—figure supplement 8. q4C and RNASeq data aligned – clone TBX4B. .

Figure 1—figure supplement 8.

Figure 1—figure supplement 9. q4C and RNASeq data aligned – clone 11.65. .

Figure 1—figure supplement 9.

Figure 1—figure supplement 10. q4C and RNASeq data aligned – clone 3.60. .

Figure 1—figure supplement 10.

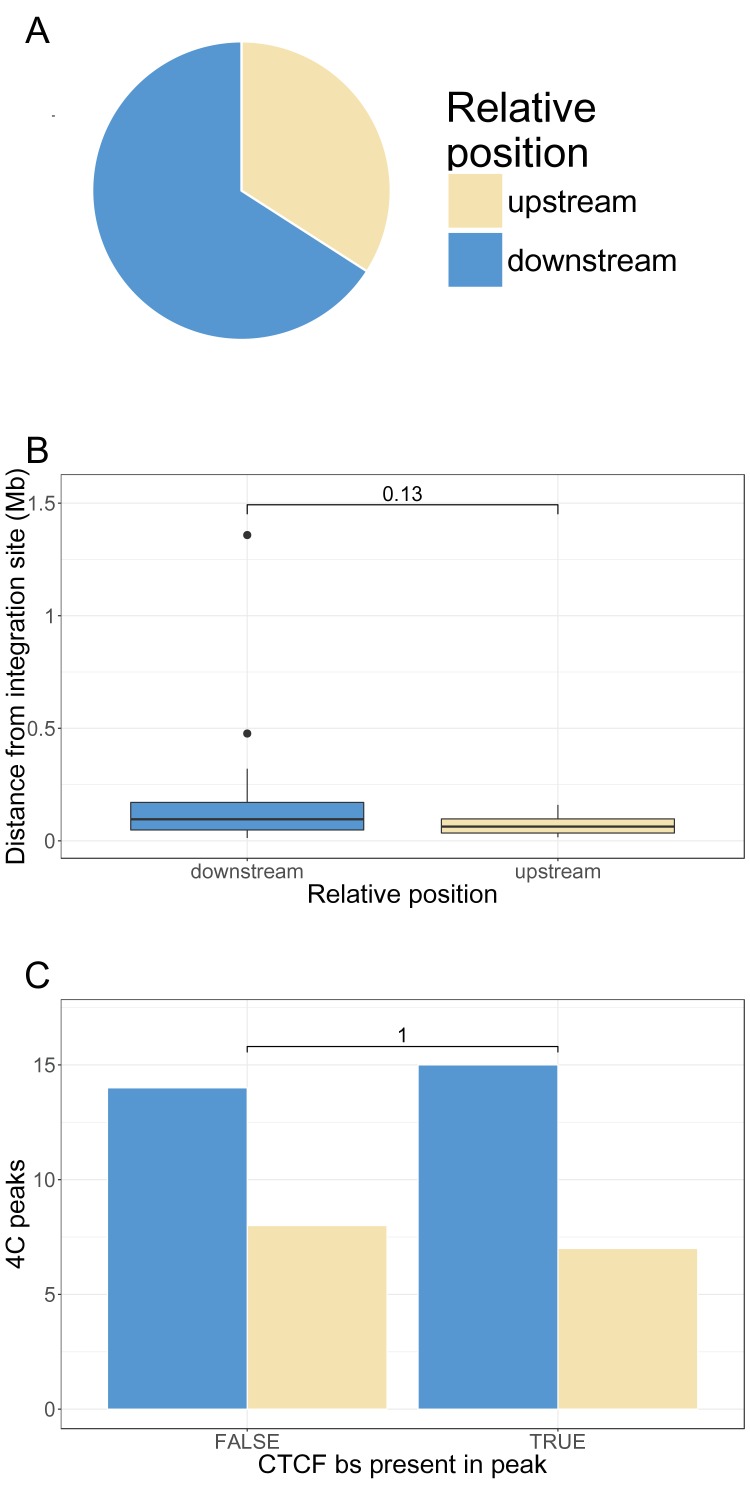
Figure 1—figure supplement 11. Position of q4C peaks relative to the HTLV-1 provirus. We defined 'upstream' peaks as q4C peaks that lie on the 5′ side of the 5′ LTR of the HTLV-1 provirus, and 'downstream' peaks as those which lie 3′ to the 3′ LTR.

Figure 1—figure supplement 11.

(A) significantly fewer peaks were found upstream of the integration site than downstream (15 vs 29; p=0.03, chi-squared goodness of fit test). (B) The distribution of absolute distance between each q4C peak and the integration site was compared between upstream and downstream peaks (p=0.13, Wilcoxon rank sum test). (C) The frequency of the presence of a CTCF binding site (CTCF-BS) in a q4C peak did not differ between upstream and downstream peaks. (p=1, Fisher’s exact test).