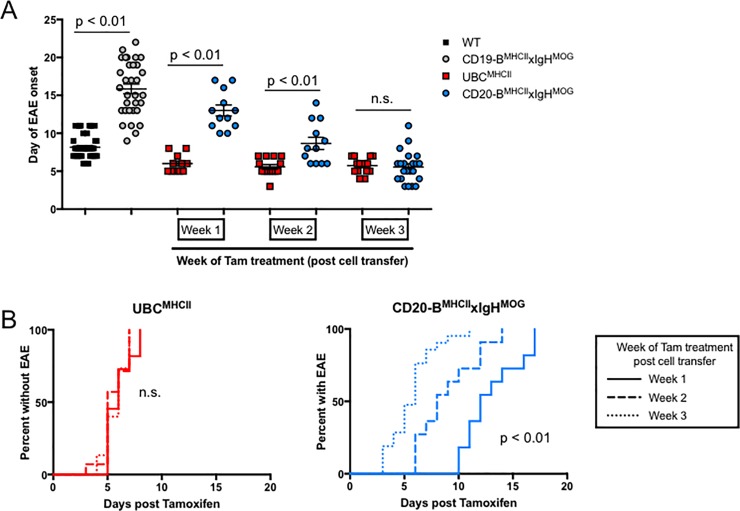
Fig 3. Tam treatment after T cell transfer results in accelerated B cell mediated EAE.
(A) Mean ± SEM day of EAE onset for WT (black squares) and CD19-BMHCIIxIgHMOG (grey circles) post T cell transfer, and for UBCMHCII (red squares) and CD20-BMHCIIxIgHMOG (blue circles) treated with Tam at either one week, two weeks, or three weeks post T cell transfer. Data is pooled from 12 different experiments with n = 1–5 mice per genotype and time point evaluated, p values calculated by unpaired t tests. (B) Time to EAE onset is not significantly different for UBCMHCII mice (left graph) treated with Tam at either Week 1 (solid line), Week 2 (dashed line), or Week 3 (dotted line) post CD4 T cell transfer. Time to EAE onset is significantly delayed for CD20-BMHCIIxIgHMOG mice (right graph) treated with Tam at either Week 1 (solid line), compared to Week 2 (dashed line), or Week 3 (dotted line) post CD4 T cell transfer. Incidence curves generated from is pooled from 12 different experiments with n = 1–5 mice per genotype and time point, with significance evaluated by log-rank test.

