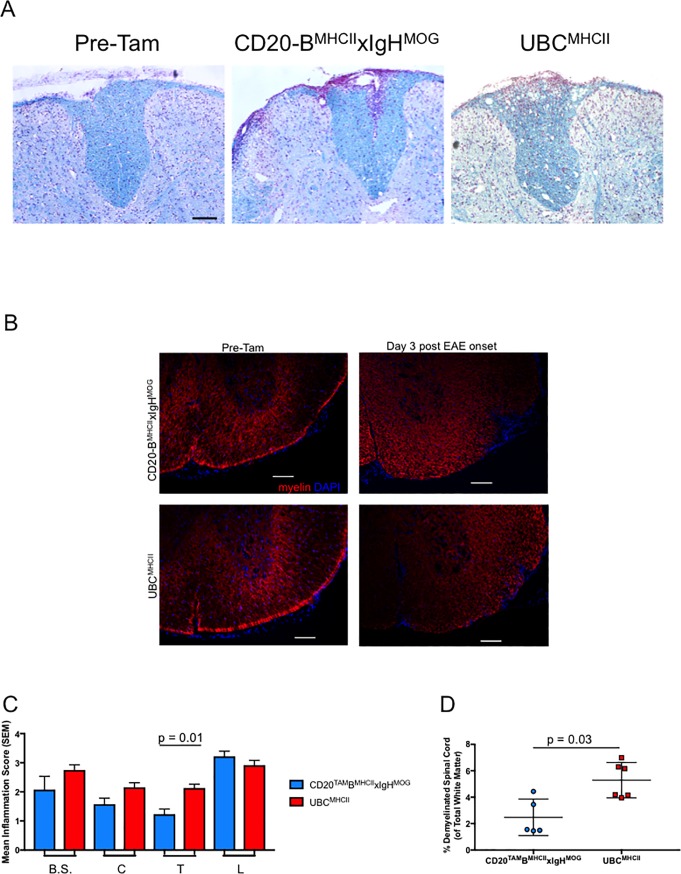
Fig 4. Inflammation and demyelination is not evident in spinal cords of encephalitic CD4 T cell recipients prior to Tam administration.
(A) Representative spinal cord sections from recipients of encephalitogenic CD4 T cells (n = 5, CD20-BMHCIIxIgHMOG mice; n = 6, UBCMHCII mice) were stained with Luxol Fast Blue, scale bar = 100um; all images generated from 10x magnification. (A) Spinal cords from CD20-BMHCIIxIgHMOG mice harvested three weeks after T cell transfer and before Tam administration (left). CD20-BMHCIIxIgHMOG mice treated with Tam three weeks after T cell transfer (middle) and harvested three days post EAE onset. UBCMHCII mice treated with Tam three weeks after T cell transfer (right) and harvested three days post EAE onset. (B) Representative spinal cord sections from recipients of encephalitogenic CD4 T cells (at least mice 5 per genotype) were stained with antibodies to detect MOG, scale bar = 100um. Spinal cords from CD20-BMHCIIxIgHMOG mice (top left) and UBCMHCII mice (bottom left) harvested three weeks after T cell transfer and before Tam administration. CD20-BMHCIIxIgHMOG (top right) and UBCMHCII (bottom right) mice treated with Tam three weeks after T cell transfer and harvested three days post EAE onset. (C) Regions from rostral to caudal sections of spinal cords from CD20-BMHCIIxIgHMOG (blue) and UBCMHCII mice (red) were harvested and scored for inflammation. Graph shows mean +/- SEM inflammation scores and Kruskal-Wallis test with Dunn’s correction for multiple comparisons was applied. B.S. = brainstem; C = cervical; T = thoracic; L = lumbar. (D) Mean (SD) percent area of demyelinated white matter was quantified for thoracic spinal cord sections from CD20-BMHCIIxIgHMOG (blue) and UBCMHCII (red) mice. Significance determined by Mann-Whitney test with two-tailed p value.

