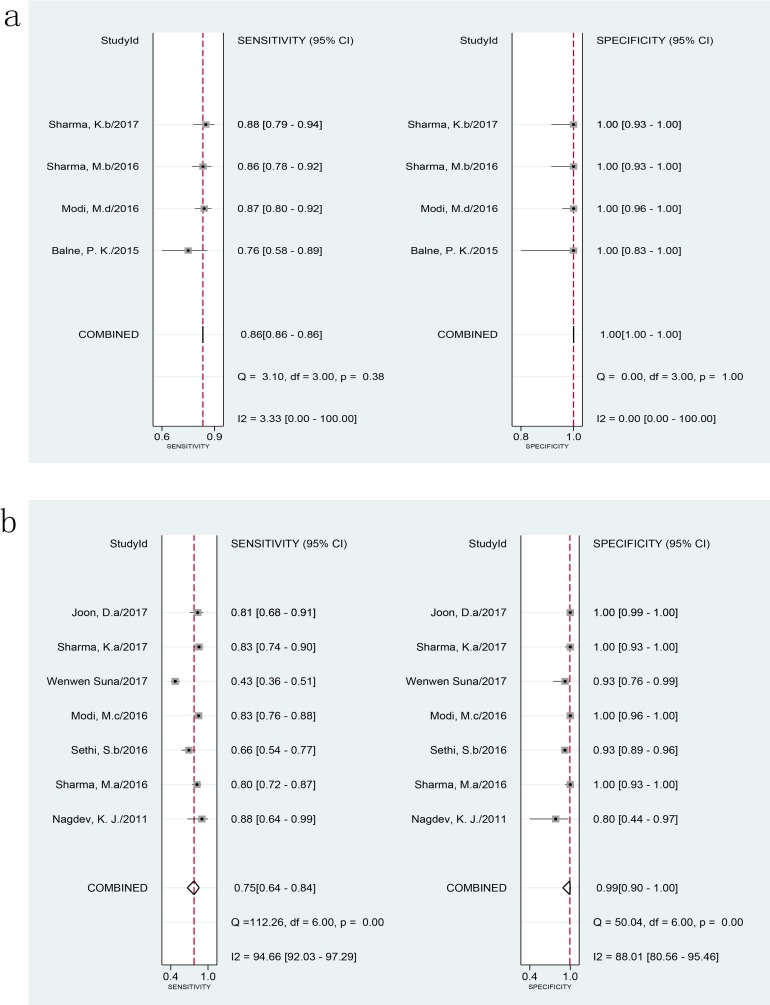
Fig 4. Forest plot of LAMP sensitivity and specificity for tuberculosis detection using different target genes against a composite reference standard.
a: MPB64. b: IS6110. The squares represent the sensitivity and specificity of one study, and the black line their confidence intervals. The diamonds represent the pooled sensitivity and specificity and their confidence intervals. LAMP: loop-mediated isothermal amplification.

