Figure 2.

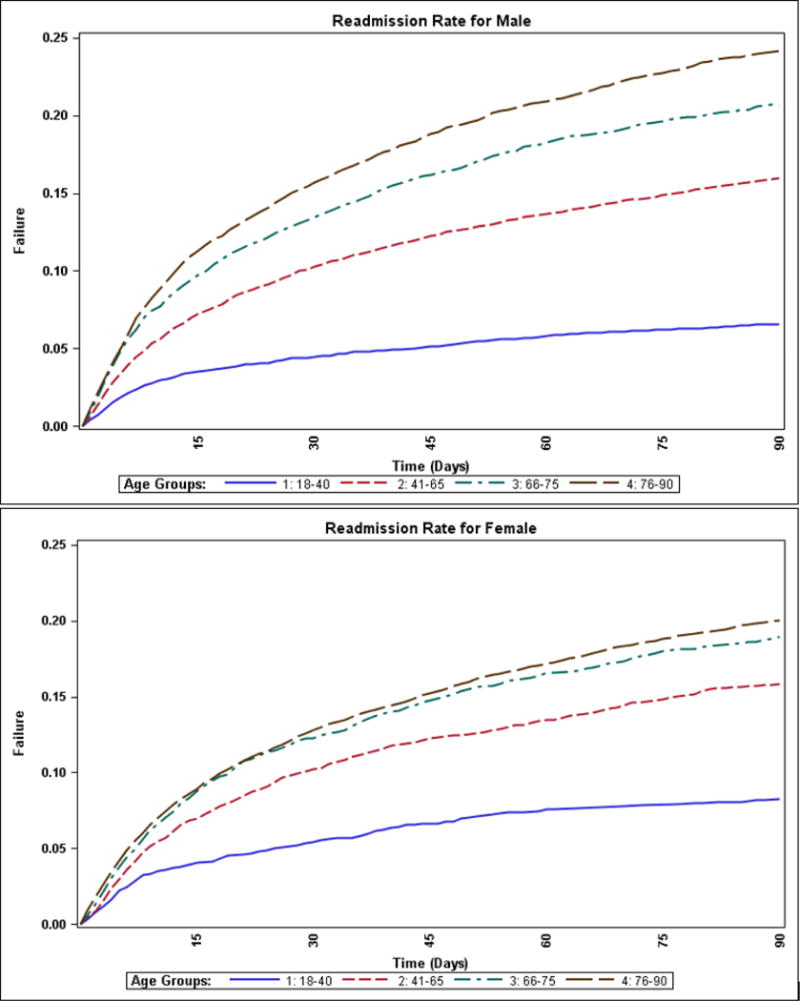
Hospital Readmission Trajectory of Four Age Groups over 90 Days by Sex (Unadjusted Kaplan-Meier Censoring Method) (Sample size for male: 33,282; for female: 19,595).
X-axis represents time (days). Y-axis represents readmission rate.

Hospital Readmission Trajectory of Four Age Groups over 90 Days by Sex (Unadjusted Kaplan-Meier Censoring Method) (Sample size for male: 33,282; for female: 19,595).
X-axis represents time (days). Y-axis represents readmission rate.