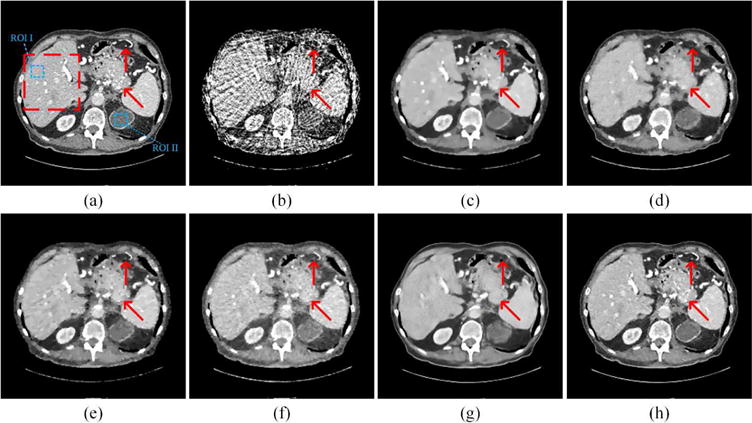
Fig. 4.

Representative abdominal images reconstructed using various methods. (a) The reference image versus the images reconstructed using (b) FBP, (c) ASD-POCS (λ = 0.07), (d) Dual-DL (n = 16, ds = 2, β = 0.03), (e) PWLS-TGV (β1 = 1 × 10⁻², β2 = 1.3 × 10⁻⁴), (f) Gamma-Reg (λ = 3 × 10⁻³, α = 1.5, β = 8), (g) FBPConvNet, and (h) LEARN respectively. The red arrows point to some key details, which can only be discriminated with the LEARN network. The red box labels a region of interest (ROI), which is magnified in Fig. 5. The display window is [−150 250] HU.
