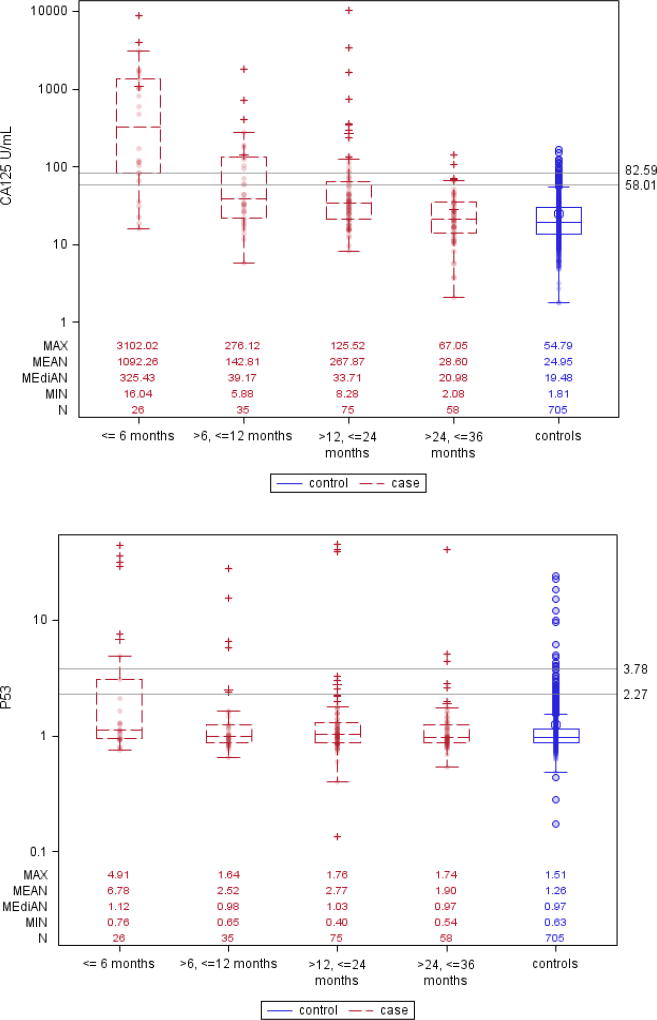
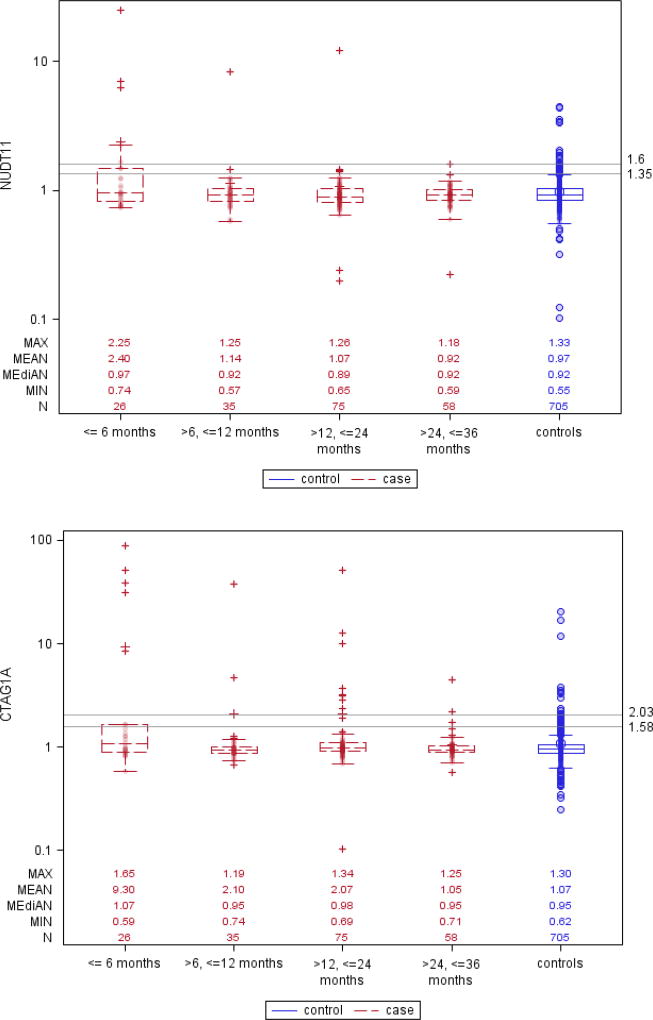
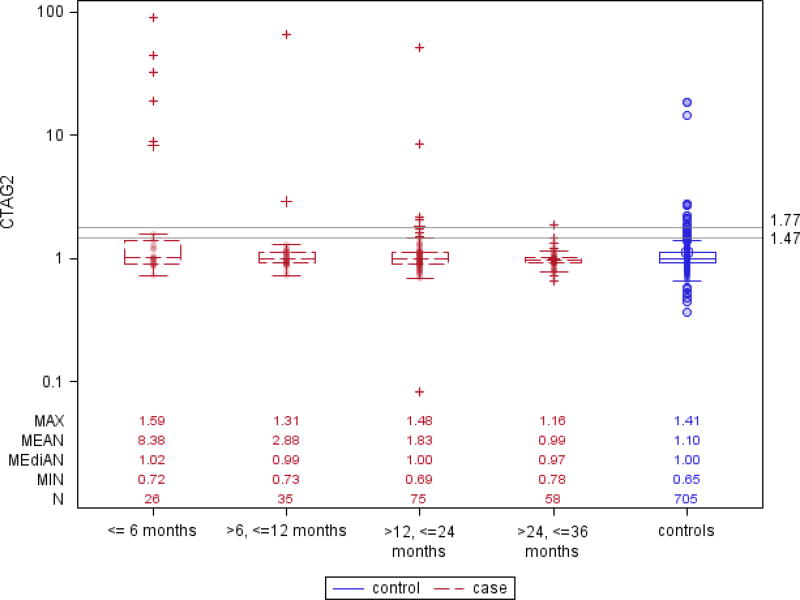
Figure 1. Box and whisker plots showing serum levels of CA125, and antibody titers against CTAG1A, GTAG2, NUDT11 and P53, for ovarian cancer cases and matched controls, by intervals of time prior to diagnosis.
Reference lines are drawn at levels of the markers’ 95% and 98% specificity in all controls.


