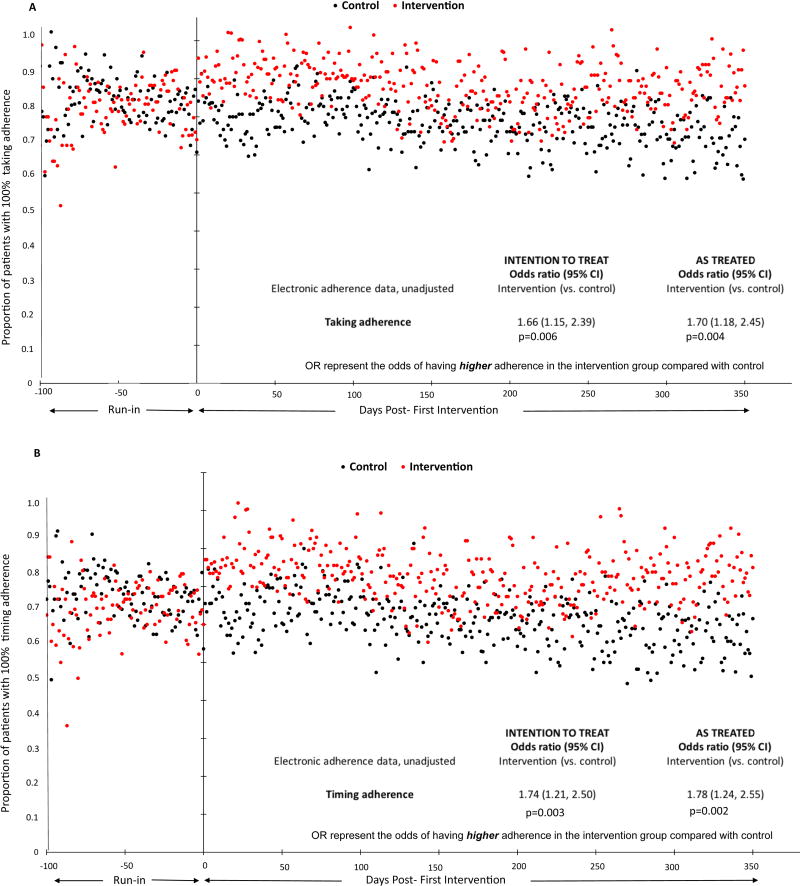
Figure 3. Comparison of (A) taking and (B) timing adherence between intervention and control groups.
The proportion of intervention (red) and control (black) participants with 100% (a) taking and (b) timing adherence on each day of observation are shown. Intention to treat analyses included the 64 intervention and 74 control participants with pillbox data in the intervention interval. As treated analyses included the 60 participants assigned to intervention who received the intervention and had pillbox data in the intervention interval, and the 78 participants who did not receive the intervention and had pillbox data in the intervention interval. The odds ratios represent the odds of having higher adherence in the intervention group compared with control.

