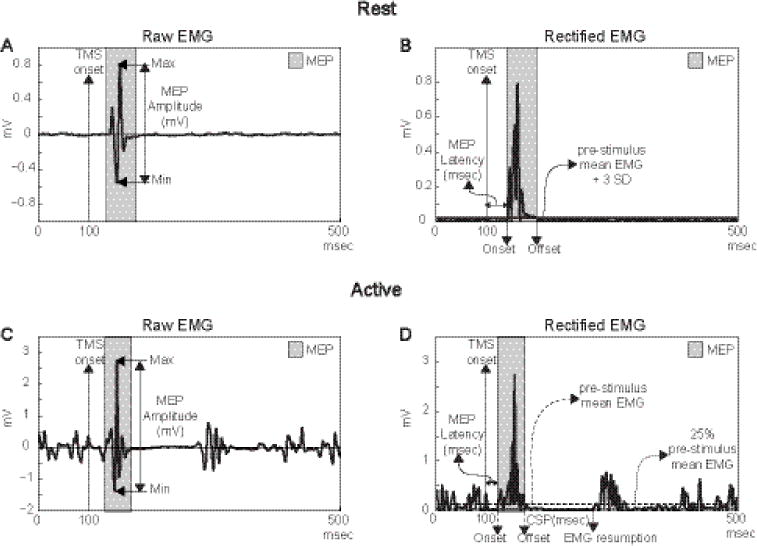
Figure 2.

A schematic diagram of the MEP derived measures analysis during resting (A and B) and active (C and D) conditions.
In both conditions, MEP amplitude was defined as the largest difference between positive and negative peaks (A and C), while MEP latency was defined as the time between TMS onset and MEP onset (B and D). During active, CSP was also defined as the time between MEP offset and the resumption of baseline EMG (D).
