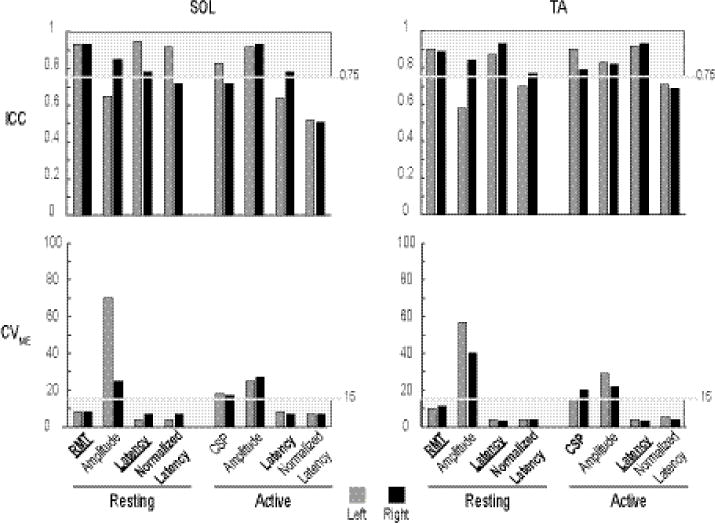
Figure 3.

Bar plots of the reliability data (ICC – top row; CVME – bottom row) of SOL (left column) and TA (right column) of four measures per condition. Light grey shaded areas indicate the region of good reliability (ICC: 0.75-1; CVME: 0-15). Among the eight CMC measures of each muscle, only those indicated by the shaded area had good reliability (unilateral; bilateral).
