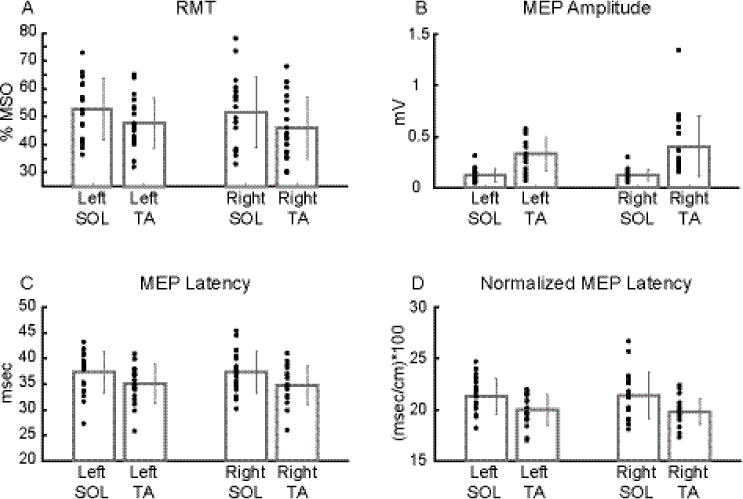
Figure 4.

Average group data of each CMC measure between muscles and sides during rest.
Bilateral RMT (A), MEP latency (C), and normalized MEP latency (D) were significantly higher in SOL than TA. Bilateral MEP amplitude (B) was significantly lower in SOL than TA. Dark grey bar plots and error bars represent mean and ± 1 SD, respectively, while black dots indicate subject data (A: mean of two RMT values; B-D: mean of 10 MEP derived values).
