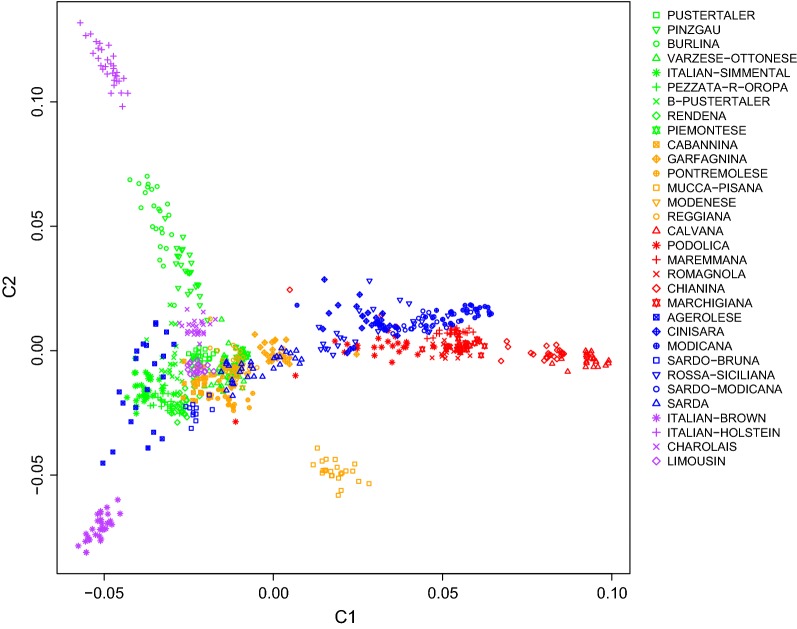
Fig. 3.
Genetic relationships based on the multidimensional scaling analysis between the analyzed cattle breeds. Points and symbols are colored based on the geographic origin of breeds; the colors are the same as those described in Fig. 2. The first two components, C1 and C2, accounted for 14 and 11%, respectively of the total variation

