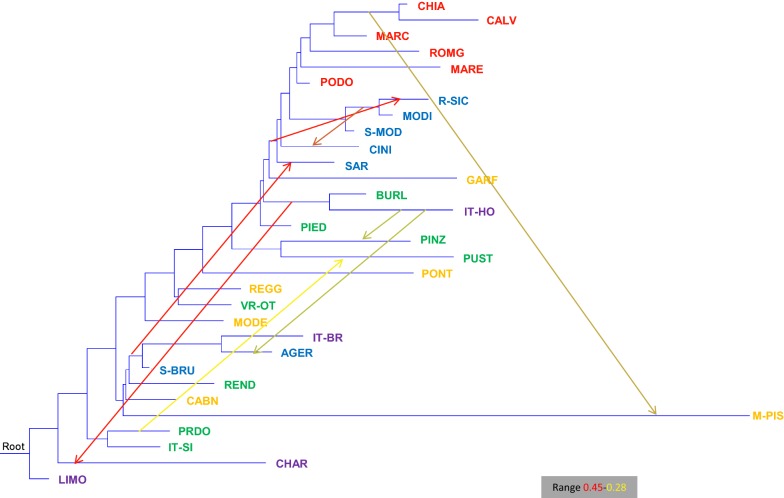
Fig. 6.
Maximum likelihood tree inferred from 32 cattle breeds when eight migration events are allowed. Migration arrows are colored according to their weight. Name of breeds are colored according to their geographical distributions as described in Fig. 2. For a full definition of breeds (see Additional file 2: Table S1)

