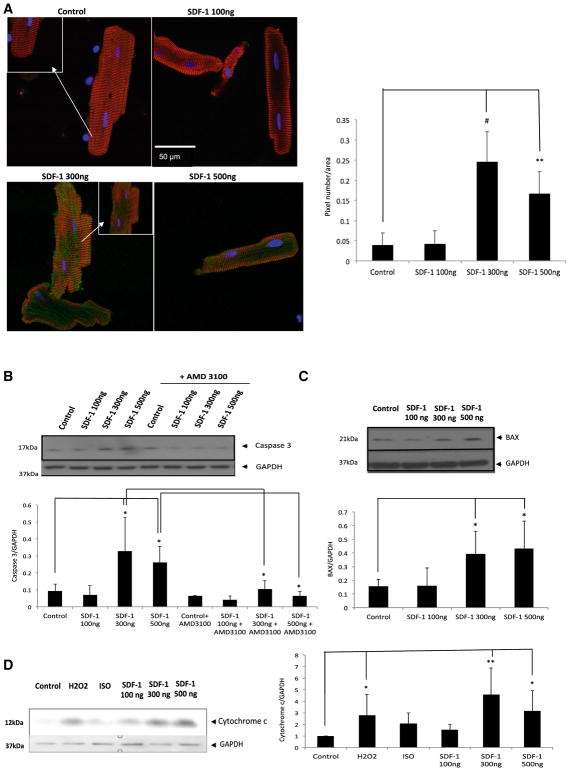
Fig. 2.
SDF-1 at high concentrations activates caspase 3 and induces cell death. Freshly isolated adult rat cardiomyocytes were treated for 24 h with either 100 or 300 or 500 ng/ml SDF-1, Apoptosis was detected by using three independent assays: a cardiomyocytes were fixed, stained with anti-caspase 3 using detection of caspase 3-like protease activity (ApoAlert Caspase 3 Fluorescent Assay Kit) and visualized with FITC conjugate (green), α-actinin antibody visualized by Cy3 conjugate (red) and nuclei were stained with DAPI (blue). Significant caspase 3 activation (green signal) was detected at ≥ 300 ng/ml. The images are representative of n = 3 experiments (left panel). The amount of green fluorescence was quantified using image j program (right panel). Each cell green fluorescence pixels was measured and normalized to its cell area. Three different experiments were chosen, in each experiment, five cells were measured; graph represents a total of 15 cells per condition (n = 15; **p < 0.01, #p < 0.001 vs. control). b Immunoblotting was performed for the activated form of caspase 3 (Asp175) (upper panel) using cardiomyocytes lysates in which cells were treated in present or absence of AMD3100 (10 mM). Pretreatment with 10 mM AMD for 1 h was followed by a 24 h treatment with 100 or 300 or 500 ng/ml SDF-1 plus 10 mM AMD. Densitometric analysis of data is shown (lower panel) (n = 3; *p < 0.05). c Immunoblotting was performed for the pro-apoptotic protein, BAX (upper panel) using cardiomyocytes lysates in which cells were treated with either 100 or 300 or 500 ng/ml SDF-1 for 24 h. Densitometric analysis of data is shown (lower panel) (n = 3; *p < 0.05). d Subcellular fractionation of cultured cells was performed using commercially available kit and cytosolic fraction was used to perform western blot analysis. Immunoblotting was performed using the cytochrome c primary antibody followed by corresponding secondary antibody. The blot was visualized using a Bio-Rad imager (left panel). Densitometric analysis of data from three different experiments is shown (right panel) (n = 3; *p < 0.05, **p < 0.01 vs. control)

