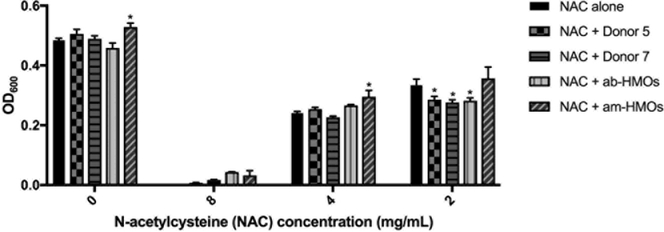
Figure 2.
Biomass for S. aureus strain USA300 after 24 h of growth in THB media alone, media supplemented with ca. 5 mg/mL of HMOs from various samples, media supplemented with varying concentrations of NAC, or media supplemented with combinations of NAC at various concentrations and HMO samples at ca. 5 mg/mL. Data expressed as mean biomass measurements (OD600) ± SEM of 3 separate experiments, each with 3 technical replicates. ** represents p = 0.0028 by two-way ANOVA, F(12 166) = 2.654 with posthoc Dunnett’s multiple comparison test comparing each NAC and HMO combination at a given NAC concentration to NAC alone at the same NAC concentration. When NAC concentration = 0 mg/mL, growth in media alone is compared to growth in media supplemented with HMOs. Any negative biomass values were assigned a value of 0.

