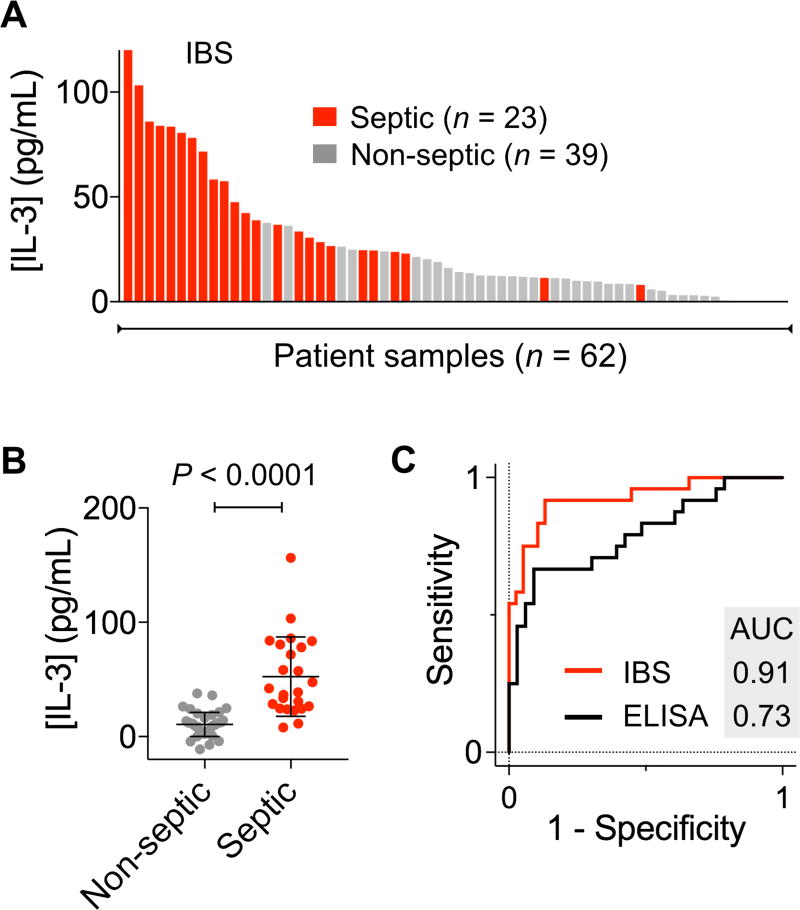
Figure 3. IL-3 as a biomarker for sepsis detection.
Patient samples (23 from septic and 39 from non-septic patients) were analyzed with the IBS assay. (A) A waterfall plot shows the IL-3 levels measured by the IBS system. Each column represents a different sample (red, septic; grey, non-septic). (B) IL-3 level was higher in septic patients than in non-septic controls (P < 0.0001, unpaired t-test). (C) A receiver-operation characteristic curve was constructed. The area under the curve (AUC) was 0.91 with IBS and 0.73 with ELISA. The optimum threshold value that maximized both sensitivity and specificity was [IL-3] = 21.7 pg/mL.

