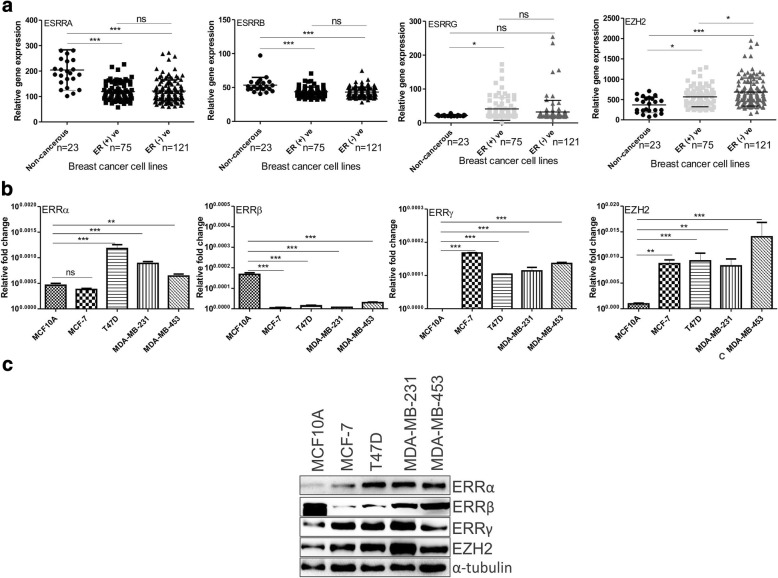
Fig. 2.
Differential expression of ERRα, ERRβ, ERRγ and EZH2 in normal and cancerous breast cell lines. a, Scatter plot shows relative expression of estrogen-related receptors and EZH2 in breast cancerous and non-cancerous cell line dataset of MERAV. b, mRNA expression level of orphan nuclear receptors in breast cancer cell lines including normal breast epithelial cells. c, Immunoblot shows the protein expression of the genes in different breast cells. Graphs were plotted with SD, which is calculated from three independent experiments. One-way ANOVA was used for statistical analysis for experiments done in triplicate.* P < 0.05, ** P < 0.005, *** P < 0.001

