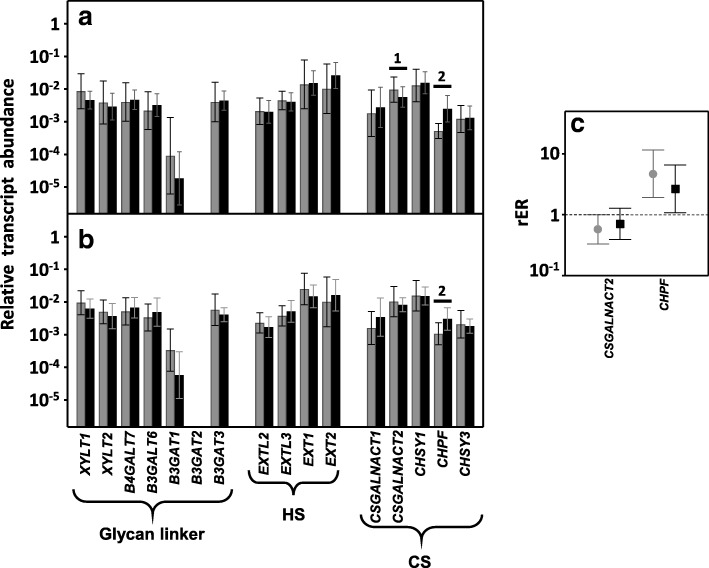
Fig. 4.
Transcription of genes encoding the glycosyltransferases involved in the biosynthesis of HS and CS chains. a, b, Relative transcript abundance of mRNAs for healthy tissues (gray bars) and tumors (black bars). Genes that display significant differences in their transcription levels are highlighted. a, Non-metastatic LSCRCs. 1: N-acetylgalactosaminyltransferase 2 (p < 0.05); 2: chondroitin polymerizing factor (p < 0.05). b, Metastatic LSCRCs. 2: chondroitin polymerizing factor (p < 0.05). c, Relative expression ratio of genes that showed statistically significant differences in expression in non-metastatic (●) and metastatic (■) LSCRCs. Values on the Y axis are on a logarithmic scale and the spreads represent the standard deviations

