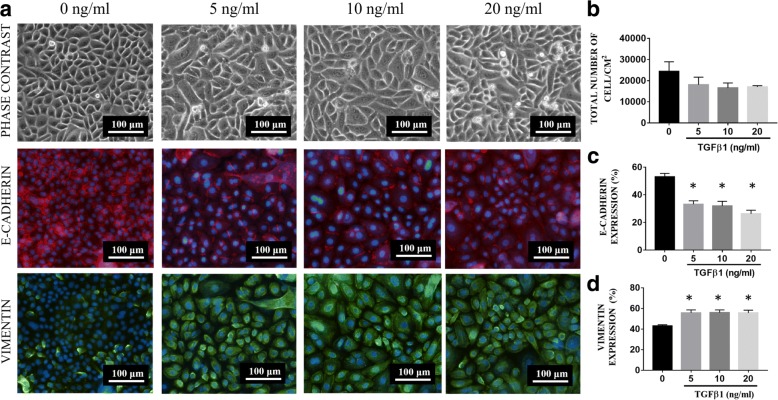
Fig. 2.
a Phase-contrast and fluorescence microscope image of RECs treated with 0, 5, 10 and 20 ng/ml of TGFβ1. b Total number of cells after a 24-h treatment with 0, 5, 10 and 20 ng/ml. There is a reduction in the total number of cells after 24 h of treatment in all the experimental groups compared with the control (0 ng/ml). c Vimentin expression. d E-cadherin expression. *P < 0.05 indicates a significant difference compared with the control

