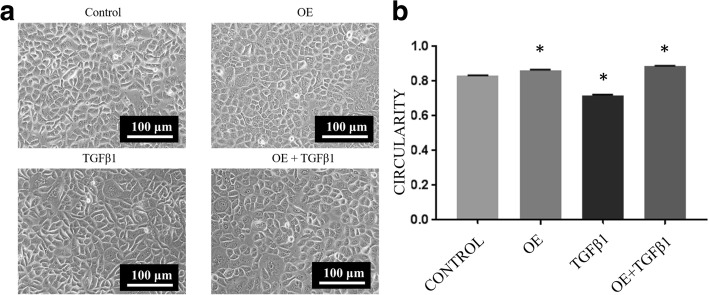
Fig. 3.
a Morphology of untreated RECs (control), 0.05% OE-treated RECs (OE), RECs with EMT induced by 5 ng/ml TGFβ1 (TGFβ1) and RECs with EMT induced by TGFβ1 treated with OE (TGFβ1 + OE) on day 3. The TGFβ1 group displays a more elongated structure than the OE and TGFβ1 + OE groups. b Cell circularity as analyzed using ImageJ software. *P < 0.05 indicates significant difference compared with control

