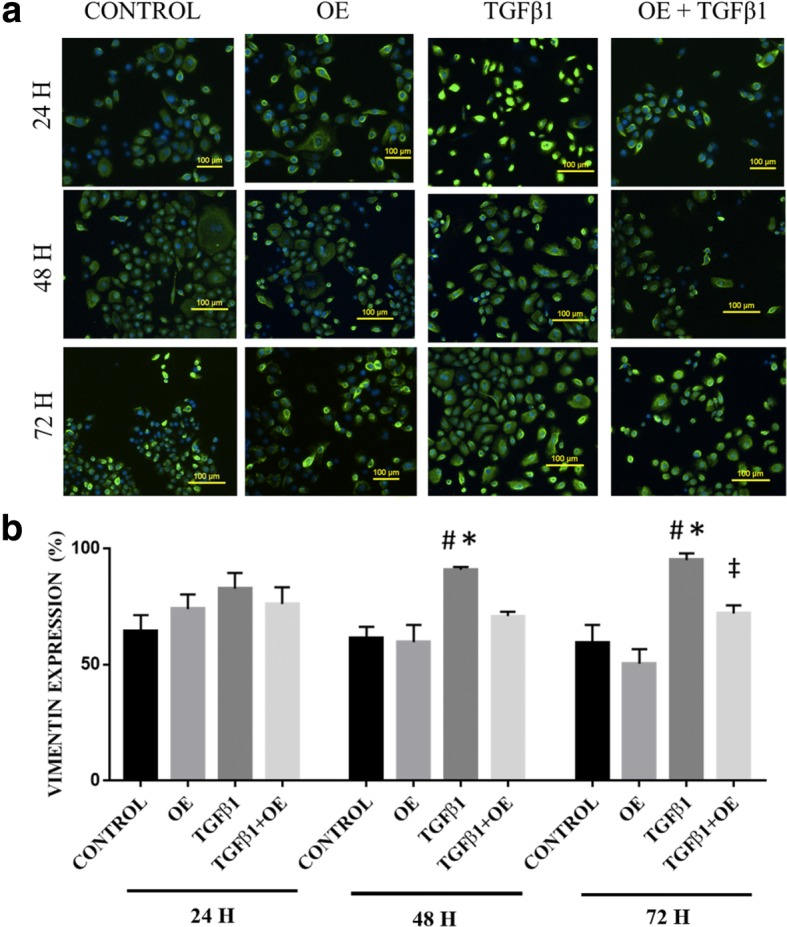
Fig. 5.

a Vimentin expression in untreated RECs (control), 0.05% OE-treated RECs (OE), RECs induced to EMT with 5 ng/ml TGFβ1 (TGFβ1) and RECs induced to EMT with TGFβ1 and treated with OE (TGFβ1 + OE) from 0 h until 72 h. Green cytoplasm indicates vimentin expression, and blue is DAPI-stained nuclei. b Vimentin expression (%) vs time per group. *P < 0.05 indicates significant differences when compared with the control, #P < 0.05 indicates significant differences when compared with OE, ‡P < 0.05 indicates significant differences when compared with TGFβ1
