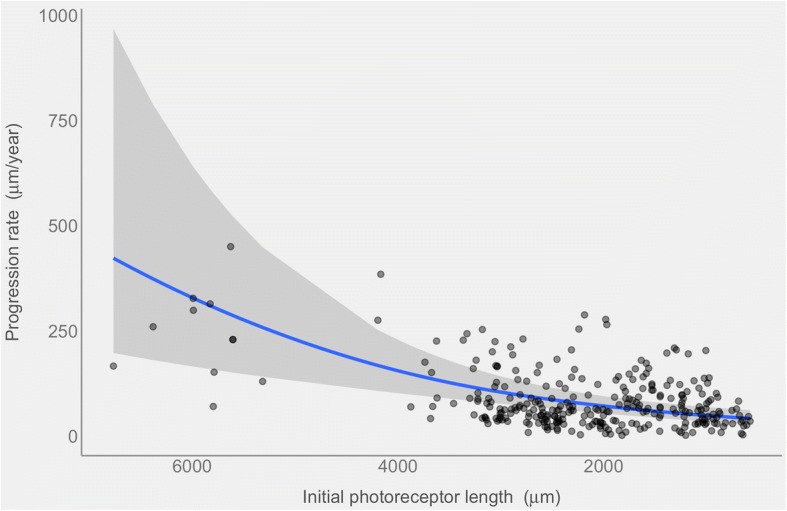
Fig. 2.

The blue line shows the progression rate (in microns/year) of the photoreceptor length decrease at different baseline lengths (in microns). The curved relationship is a direct consequence of the generalized linear model when displayed on the response scale. The grey band represents the 95% point wise confidence intervals. Single observations are overlaid as semitransparent black dots
