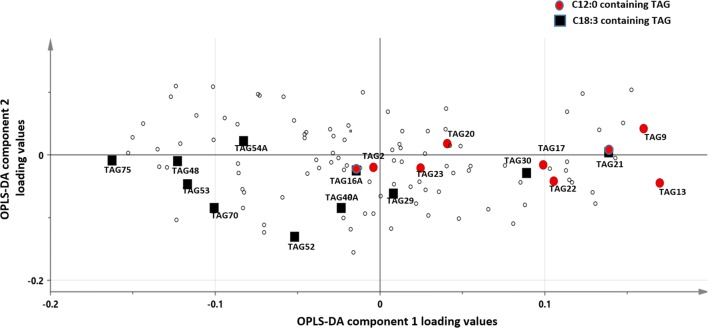
Fig. 2.
An OPLS-DA loading plot showing the spread of C12:0 and C18:3 containing TAG along the x-axis found previously (Fig. 1a) to differentiate T2DM from IS+IR subjects. Unlike the C12:0 containing TAGs, the TAGs comprising C18:3 feature on both sides of the x-axis implying depletion of certain recipient TAGs (right side) as oppose to enrichment of others (left side) with diabetes

