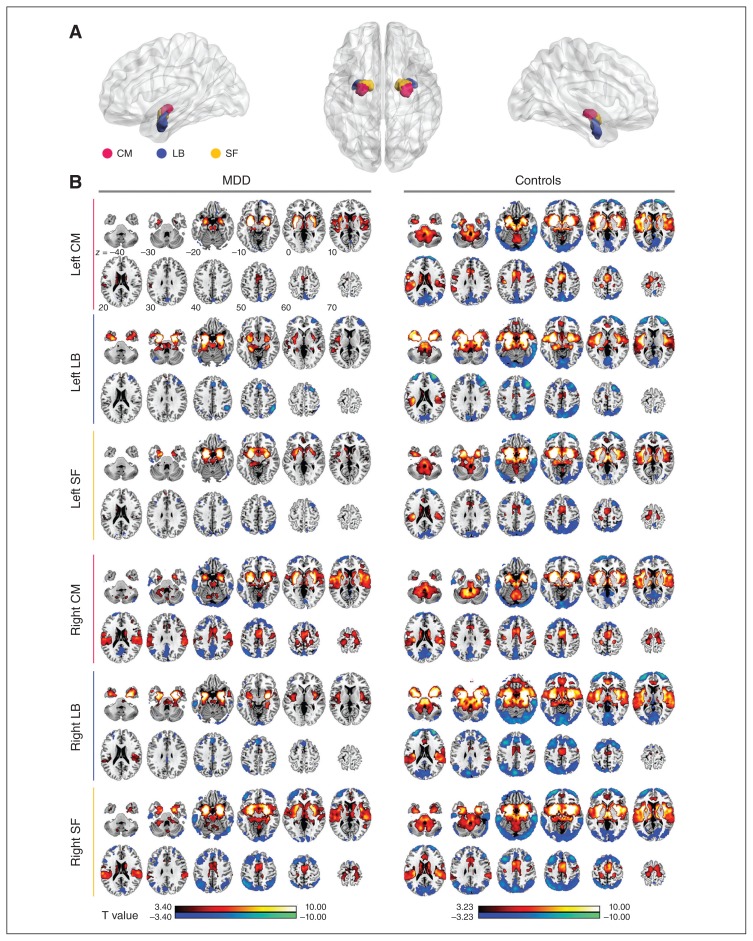
Fig. 1.
The mean dynamic functional connectivity (dFC) map of each amygdalar subregion in each group. (A) The subregions of the amygdala: the centromedial (CM; magenta), laterobasal (LB; blue) and superficial (SF; yellow). (B) The mean dFC map of each amygdalar subregion in the major depressive disorder (MDD) and control groups. Warm colours indicate positive mean connectivity and cool colours represent negative mean connectivity. Right SF Right LB Right CM Left SF Left LB Left CM

