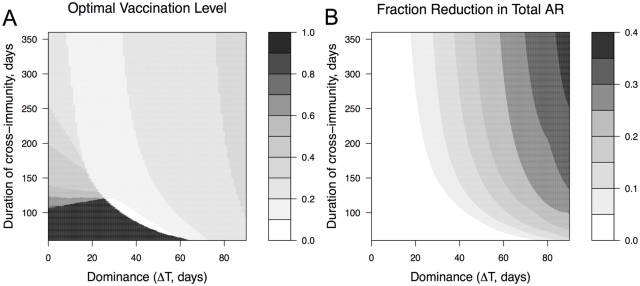
Fig 6. Optimal vaccination level and the extent to which it reduces the total attack rate.
Panel A shows the optimal vaccination rate that minimizes the total attack rate and how it depends on the degree of dominance (time of introduction of the second strain) and duration of cross-immunity. Panel B shows the corresponding reduction in total attack rate calculated as the difference between the total attack rates at maximal coverage and optimal coverage divided by the total attack rate at the maximal coverage. All other model parameters are in Table 1.

