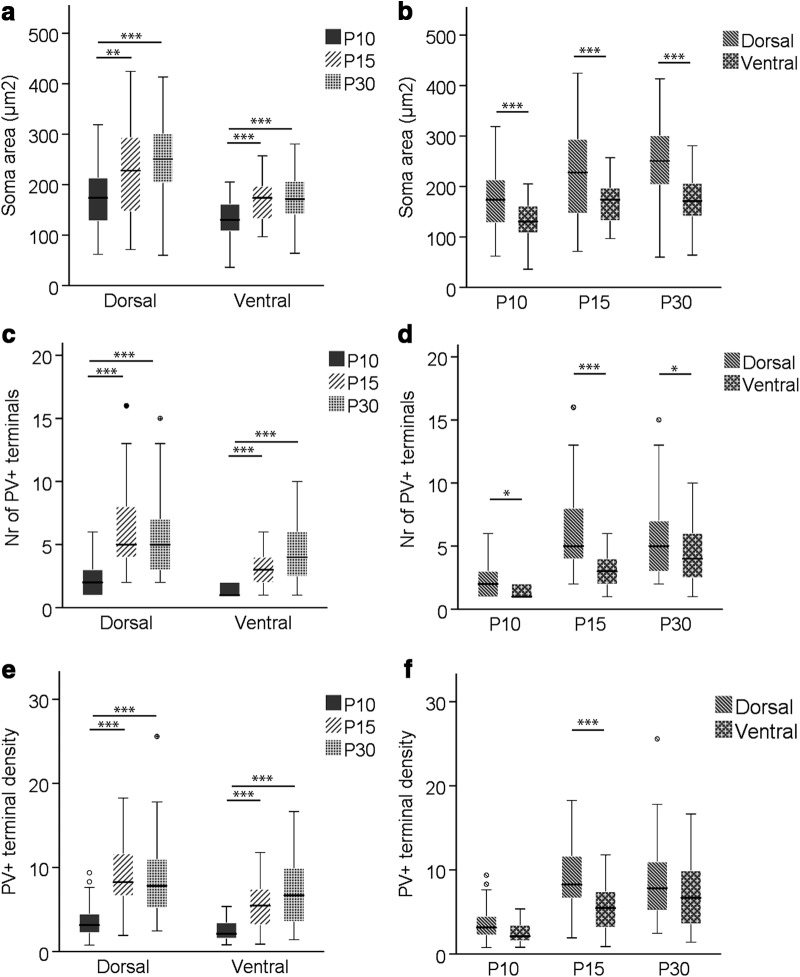
Figure 3.
Box-and-whisker plots showing cross-sectional area of somata and number and density of PV+ perisomatic terminals per cell per thin section at P10, P15, and P30 in dorsal and ventral MEC LII. a, c, e, Changes in average cross-sectional soma area and number and density of PV+ terminals, respectively, during ontogeny in dorsal and ventral LII. b, d, f, Dorsoventral differences in average cross-sectional soma area and number and density of PV+ terminals, respectively, per time point. The middle bar of each box plot represents the population median, and the 25th and 75th percentiles are represented by the lower and upper boundaries of the boxes, respectively. The minimum and maximum values are represented by the lower and upper ends of the whiskers. Dots represent outliers, i.e., values that exceeded the 75th percentile + 1.5 × (75th percentile – 25th percentile). *, p ≤ 0.05; **, p ≤ 0.01; ***, p ≤ 0.001.

