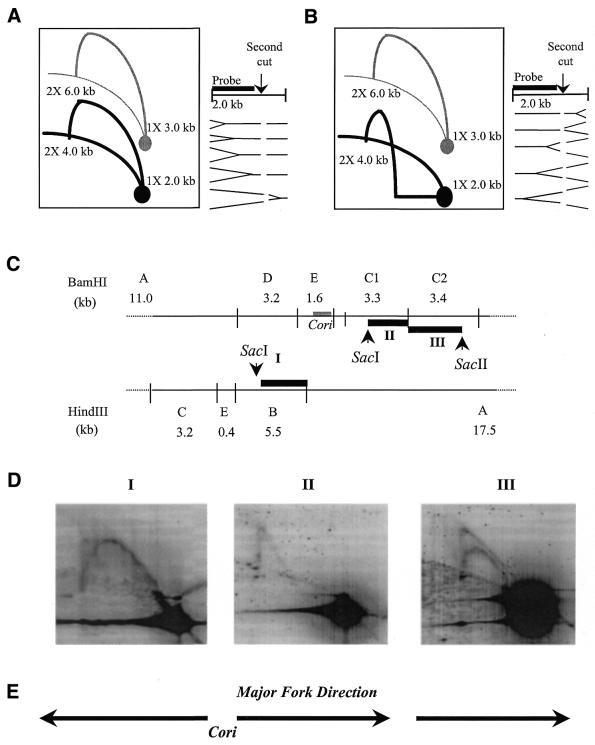
Figure 7.
Fork direction assays. Compared with the original hybridization pattern, the resultant hybridization pattern (black) is decreased in linear size due to second unique endonuclease digestion of the first dimensional resolved DNA and interpretation of this pattern is indicated as the simple replication fork (A) moving from left to right and (B) moving from right to left in the region of interest. Based on Friedman and Brewer (31). (C) Restriction endonuclease map of 12.2 kb region with centralized Cori. Thick black lines marked with roman numerals (I–III) represent fragments used as random-primed 32P-labeled probes: probe I is SacI/HindIII segment of HindIII fragment B; probe II is SacI/BamHI segment of BamHI fragment C1; and probe III is BamHI/SacII segment of BamHI fragment C2. (D) NA1000 wild-type C.crescentus 15 min synchrony time-point chromosomal DNA is digested first with BamHI or HindIII, run in first dimension gel electrophoresis, and digested with a second unique endonuclease (SacI or SacII) that cleaves within the BamHI or HindIII fragment before the second dimension gel electrophoresis run. The 2-D gel was then alkaline Southern blotted, and hybridized with 32P-labeled probes [see (C)] marked with corresponding roman numerals above each hybridized blot. (E) Direction of replication fork movement interpreted from the hybridization patterns depicted in the 2-D gel blots.

