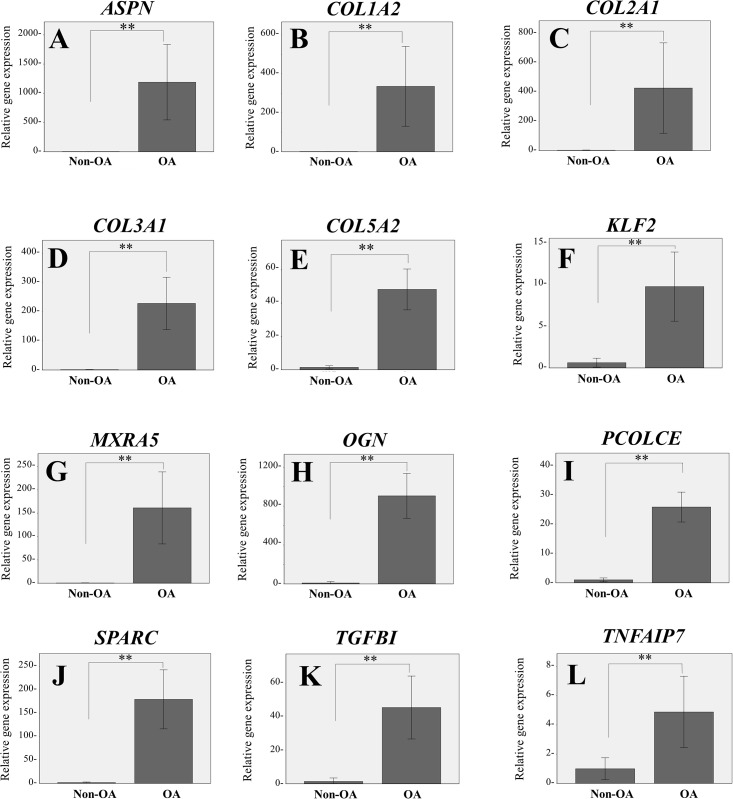
Fig 2. qRT-PCR replication study.
The figures show relative gene expression of 12 prominently overexpressed gene in OA chondrocytes detected by the microarray analysis. ASPN (A), COL1A2 (B), COL2A1 (C), COL3A2 (D), COL5A1 (E), KLF2 (F), MXRA5 (G), OGN (H), PCOLCE (I), SPARC (J), TGFBI (K), and TNFAIP6 (L). The data were shown as average ± standard error of mean (SEM) (**: p < 0.01).

