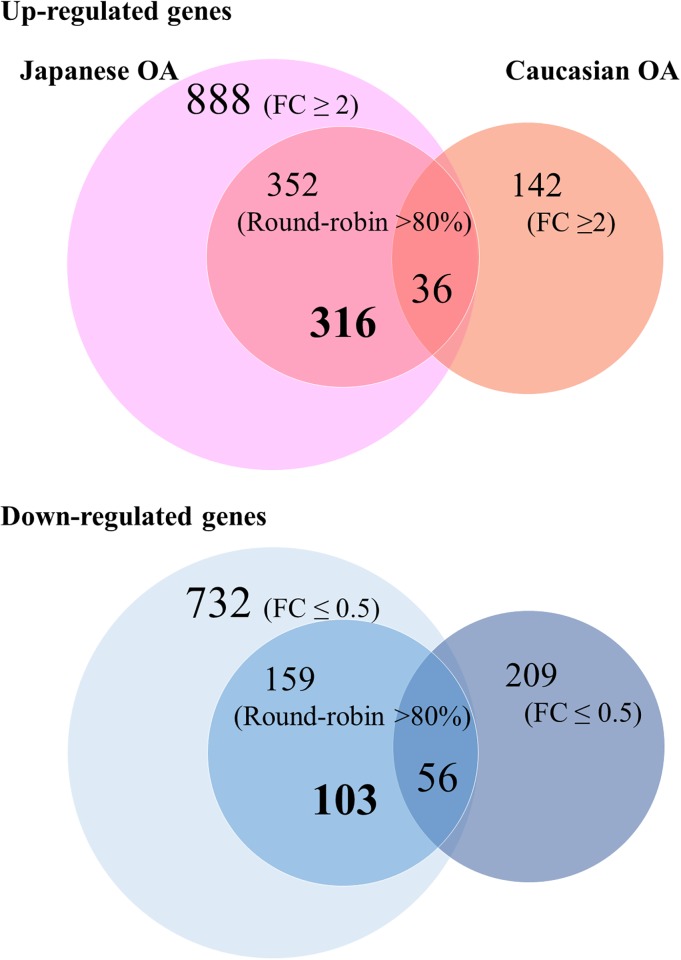
Fig 4. Compared gene profiles.
Venn diagram demonstrating the overlap of the differentially expressed genes between secondary and primary hip OA. Overlapping portion of the three circles indicates the genes significantly expressed in both studies in common (36 up-regulated genes and 56 down-regulated genes). In the inner circles on the left side, the area not overlapped with the primary OA’s circle indicate differentially expressed genes in secondary (316 up-regulated genes and 103 down-regulated genes).

