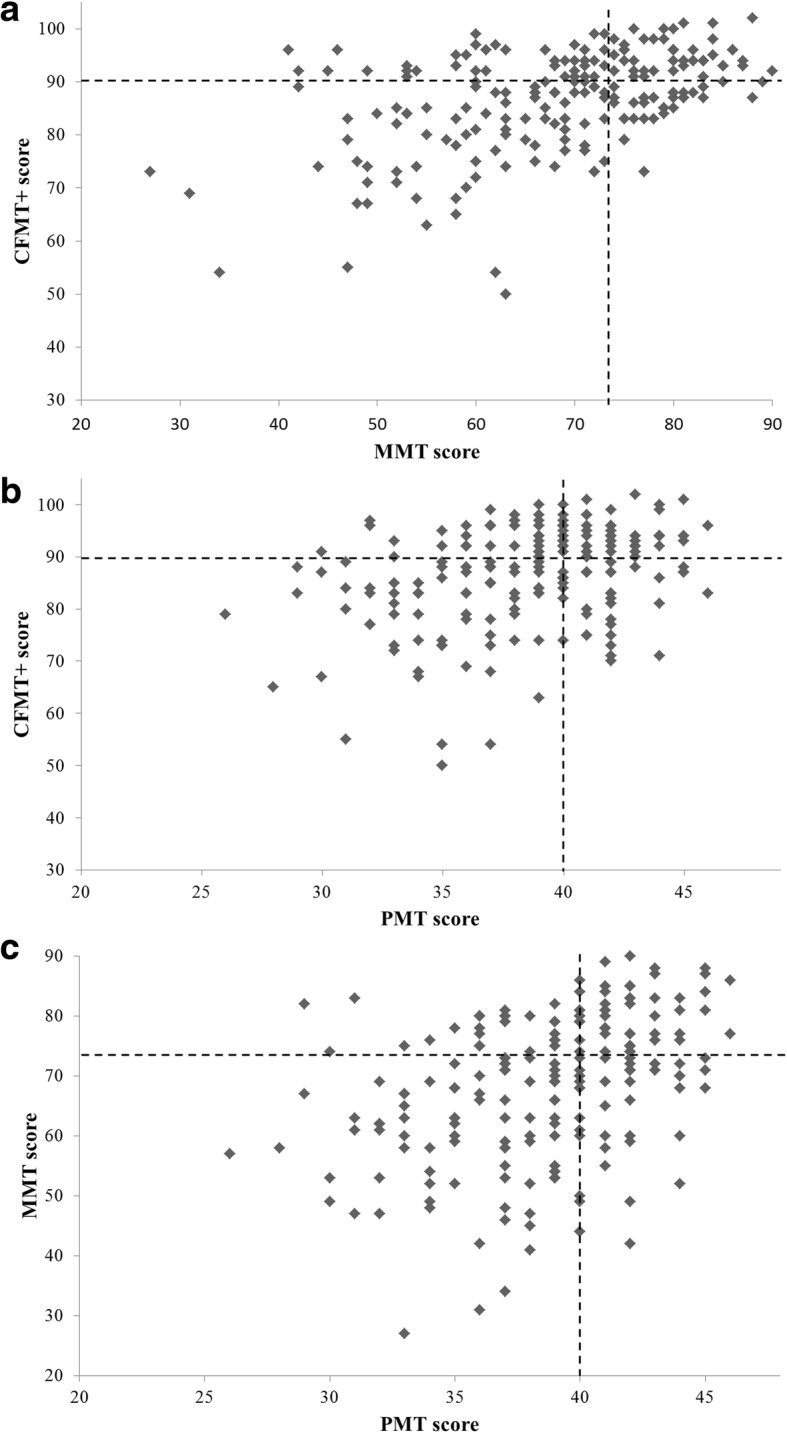
Fig. 8.

Correlations in performance. Correlation between the experimental group’s performance on the (a) CFMT+ and MMT, (b) CFMT+ and PMT, and (c) MMT and PMT. Dashed lines represent cut-off values for superior performance on each test. CFMT+ long form of the Cambridge Face Memory Test, MMT models memory test, PMT pairs matching test
