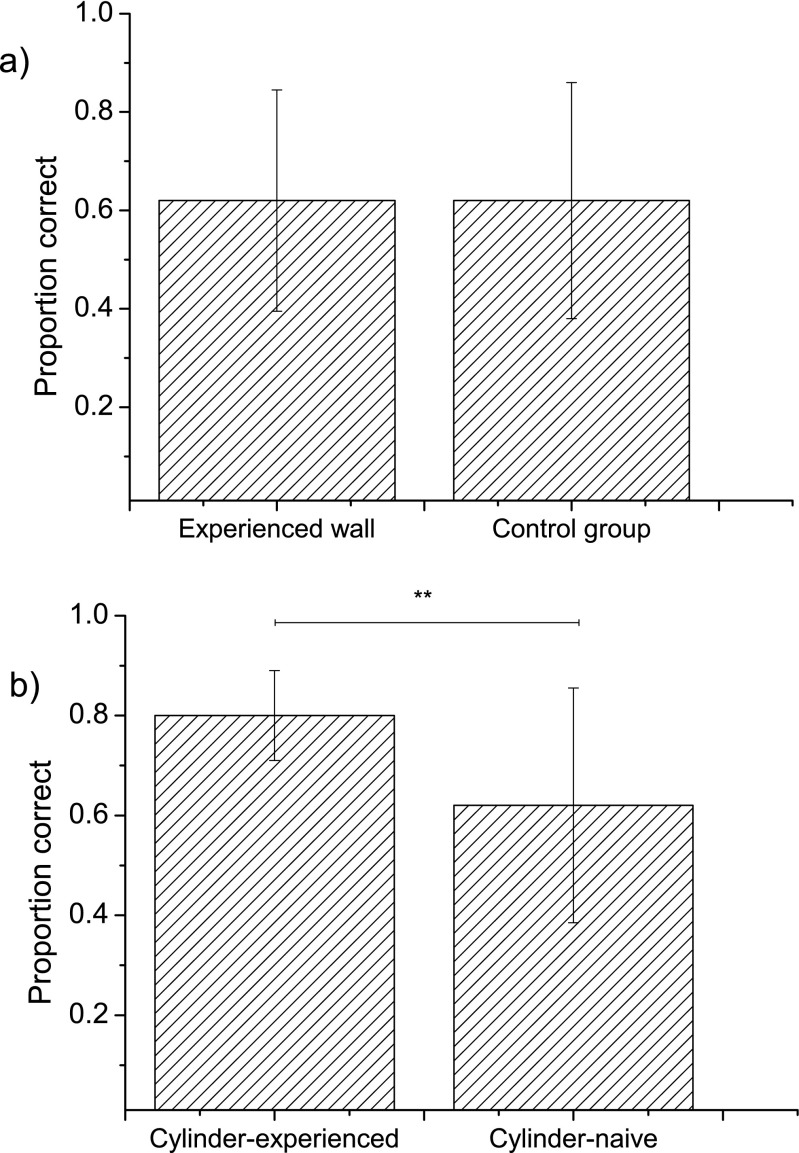
Fig. 1.
The average proportion of correct attempts in ten sessions in a group 1 (birds that had experience of a transparent wall) versus the control group and b group 2 (the birds with experience of a transparent cylinder) compared to the pooled groups from a (wall + control = “cylinder-naïve”). The error bars are 95% confidence intervals

