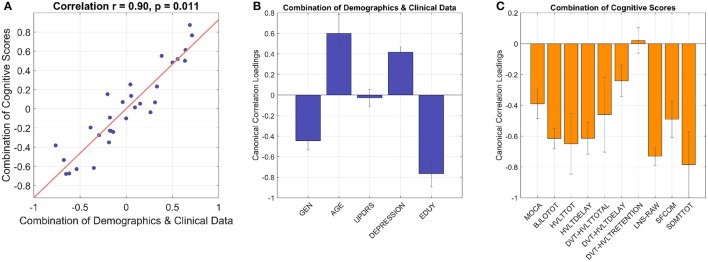
Figure 2.
The CCA model shows inter-correlated cognitive patterns with demographics and clinical data. The linear combination of demographics/clinical data is significantly correlated with the linear combination of cognitive performances with correlation coefficient 0.90 and p 0.01 (A), cross-validation with leave-one-out). (B) Gender, age, depression, and education have significant loadings in the combination of demographics and clinical data (i.e., 95% confidence interval does not cross zero as indicated by error bars). In the combination of cognitive scores (C), all the variables show significant loadings except standardized HVLT Recognition Trial Score as the 95% confidence interval crosses zero. GEN, gender; EDUY, education in years; MOCA, Montreal Cognitive Assessment; BJLOTOT, Bento Line Orientation Total Score; HVLTTOT, Hopkins Verbal Learning Test-Revised Total Score; HVLTDELAY, HVLT Delayed Recall Score; DVT-HVLTTOTAL, standardized HVLT Total Score; DVT-HVLTDELAY, standardized HVLT Delayed Recall Score; DVT-HVLTRETENTION, standardized HVLT Recognition Trial Score; LNS-RAW, raw Letter-Number Sequencing Test Score; SFCOM, Sematic Fluency Test—combination; SDMTTOT, Symbol Digit Modalities Test total scores.

