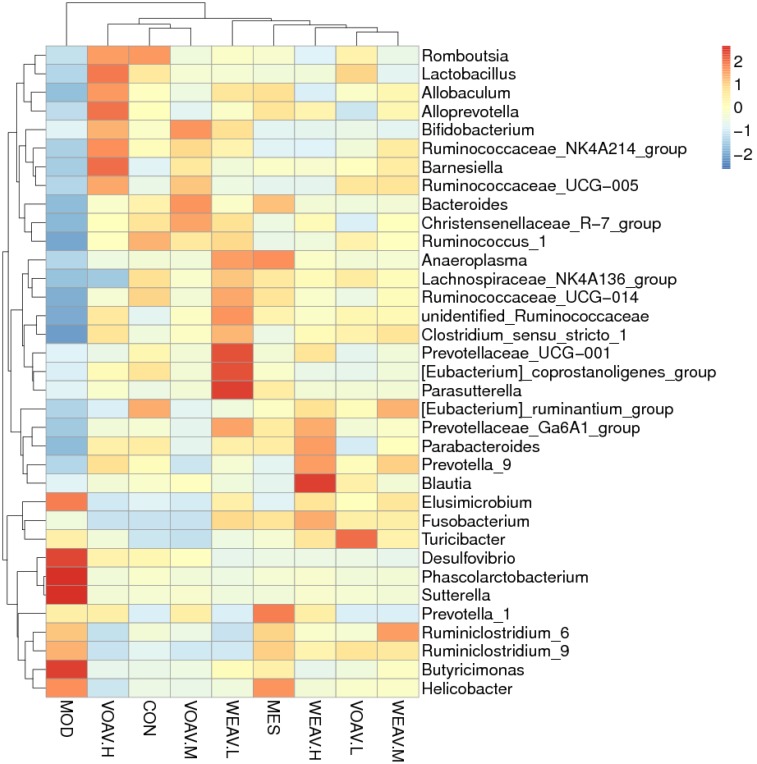
FIGURE 8.
Cluster heat map analysis of the 35 most predictive operational taxonomic units (OTUs) belonging to the genus. Three stool samples were randomly chosen, Heat map represented by color ranging from blue, negative correlation (–2) to red, positive correlation (2). Abscissa axis represented sample information and vertical axis represents annotation information for species. The clustering tree on the left side indicates species clustering, on the top, sample clustering is shown. The values of the hot spot in the center represent Z values, which are standardized per species abundance per line.

